
Eduventures 2018 Student Success Ratings are available right now. You can learn more about the Ratings by reading our methodology.
What do Massachusetts Maritime Academy, University of South Florida, and Mount Saint Mary’s University have in common?
Over the past three years, they have consistently over-performed on student success according to Eduventures® Student Success Ratings. Our ratings present a solution to a common problem in best practice research: It’s hard to identify true best practice. Thus, we end up with “practices” research.
More than a decade ago, this problem spurred Eduventures to develop a means for identifying true best practice institutions. Today, this method has evolved into the Student Success Ratings.
Sometimes, we have a bit of fun applying the ratings to teams competing in March Madness and the College Football Playoff, but, in all seriousness, let’s start by making some subtle distinctions. To be true to their original purpose, we quite purposely call them “ratings” and not “rankings.” Rather than bestow a crown upon a victor, we hope to encourage the practice of self-reflection balanced with competitive comparison.
Our Student Success Ratings (for traditional undergraduates) , allowing institutions to measure themselves against their own efforts within the context of their peers. They also play a growing role in how high school students and their families evaluate which college they want to go to, based on where they might be most successful.
Using these ratings, an institution should be able to ask and answer:
- Are we doing well given who we are?
- Who among our peers and aspirants is doing well?
- To whom can we look for advice and counsel on student success?
In short, the Student Success Ratings measure the ability of an institution to make demonstrated improvements in student retention and graduation rates (evidence of success) while overcoming contextualized institutional circumstance (performance model).
By “contextualized institutional circumstance,” we mean the types of students an institution serves and the inherent characteristics of the institution. We can explain 75% of student success with these variables alone. It is a powerful model in and of itself; taken together with trend scores, it creates an even stronger composite rating of student success.
How do the ratings work?
The Student Success Ratings are comprised of four individual scores. Each score is “graded on a curve,” if you will—normalized on a 100-point scale. Institutions are only compared against like institutions. For example, we compare public doctoral institutions only against each other while we treat private master’s institutions similarly. That means that Stanford University can’t blow the curve for The Ohio State University (OSU), and OSU can’t blow the curve for Appalachian State University.
- Performance Model Scores
- Performance Against Predicted – How well did the institution perform against its predicted score in a performance regression model?
- Percent of Headroom – How much did the institution over or underperform relative to how much room it had to improve? This somewhat mitigates the effects of being a high performing institution with little to no room to improve.
- Evidence of Success Scores
- Retention Trend – How did the institution stack up on 10-year trend in first-time full-time retention rate?
- Graduation Trend – How did the institution stack up on 10-year trend in six-year graduation rate?
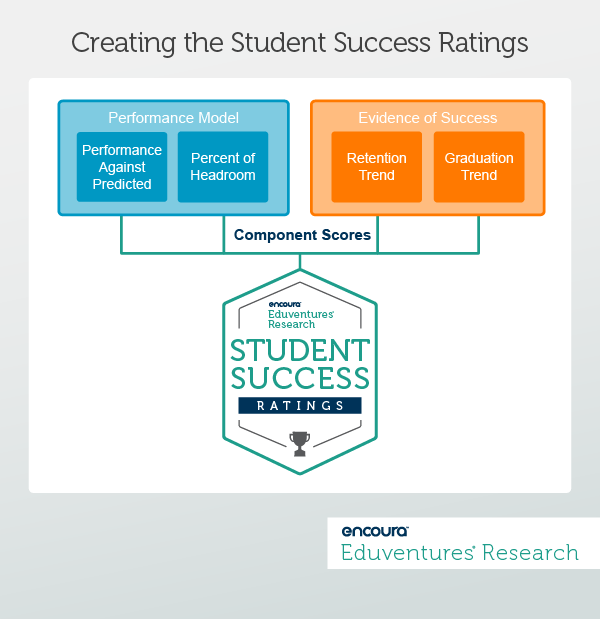
In the end, we average all four scores to create the Student Success Rating. Et Voilà! That’s how it’s done.
Using the Ratings
After three years of following this method, we’ve looked back at the performance of institutions that have been included every year. We can divide them into performance categories:
- Overperformers (top 10%)
- Moderate overperformers (next 20%)
- Average performers (middle 40%)
- Moderate underperformers (next 20%)
- Underperformers (bottom 10%)
Doing so reveals the stark differences in what it means to be an overperforming institution vs. an underperforming institution. For example, public overperformers made solid improvement in first-year retention (+6 ) and stellar improvement in six-year graduation (+12) in the prior decade. Underperforming publics saw slight declines in first-year retention (-2) and six-year graduation (-2).
Interestingly, the retention and graduation rates of overperforming publics are just as good as those of overperforming privates (Table 1).
Table 1: Key Metrics of Performance Groups - Public
| 3YR AVG | Overperformer | Moderate Overperformer | Average Performer | Moderate Underperformer | Underperformer |
|---|---|---|---|---|---|
| Student Success Rating | 69 | 60 | 50 | 41 | 31 |
| Retention Rate | 86 | 82 | 77 | 72 | 66 |
| Graduation Rate | 64 | 60 | 52 | 44 | 37 |
| Retention Trend | +6 | +4 | +3 | +1 | -2 |
| Graduation Trend | +12 | +9 | +4 | +1 | -2 |
| Perf. Against Predicted | +18 | +8 | 0 | -9 | -18 |
Likewise, private overperformers made strong improvement in both first-year retention (+7) and six-year graduation (+9) in the prior decade. Underperforming privates, however, saw concerning declines in first-year retention (-7) and six-year graduation (-6), see Table 2.
Table 2: Key Metrics of Performance Groups - Private
| 3YR AVG | Overperformer | Moderate Overperformer | Average Performer | Moderate Underperformer | Underperformer |
|---|---|---|---|---|---|
| Student Success Rating | 70 | 62 | 54 | 45 | 34 |
| Retention Rate | 84 | 83 | 79 | 72 | 64 |
| Graduation Rate | 66 | 66 | 60 | 50 | 43 |
| Retention Trend | +7 | +4 | +1 | -1 | -7 |
| Graduation Trend | +9 | +6 | +2 | -2 | -6 |
| Perf. Against Predicted | +18 | +9 | +1 | -9 | -20 |
The Bottom Line
In both cases, public and private, overperforming institutions are strongly out-doing the performance model—stretching far beyond what institutional circumstance is saying they should be able to do. Our original hypothesis from 2007 was that best practice lies in this ability to demonstrate progress regardless of inherent institutional constraints. These institutions are pushing the practice of student success forward in some way, and true “best practice” lies in knowing how.
Eduventures Research subscribers can read more in our recently published report, Student Success Ratings: Identifying Best Practice. Learn more about our rating method as well as how to use the Student Success Ratings to learn about your institution and how to find your most appropriate best practice examples.
Efforts to improve student success involve almost every constituent on campus and are among the most complex endeavors an institution can make. Institutions of different sizes with different student bodies and different missions must find contextually appropriate approaches. Even then, changing the institutional culture, prioritizing a new strategy, and executing targeted programs is challenging.
The Eduventures Student Success Ratings offer an excellent starting point for institutional self-management on student success. By identifying best practice examples, the Report can help institutions find their own way.
Join us on the Student Success Ratings webinar to learn:
- Insight into the methodology used to create the ratings system
- Which colleges and universities are beating the student success odds and why
- How institutions can use the ratings to examine their own student success efforts
Thank you for subscribing!
