
For years, one constant in higher education was the steady rise in bachelor’s degree conferrals. This trend has seemingly ended abruptly. October’s data release from the National Center for Education Statistics confirmed that bachelor’s degree conferrals declined for the first time in decades—a striking development.
The Backdrop
In 19 of the last 20 years, bachelor’s degree completions grew by more than 1% year-over-year, each year reaching highs of 4% or more. In 2022, however, bachelor’s conferrals declined by more than 2%.
Figure 1 plots both bachelor’s degree conferrals and year-over-year growth rates.
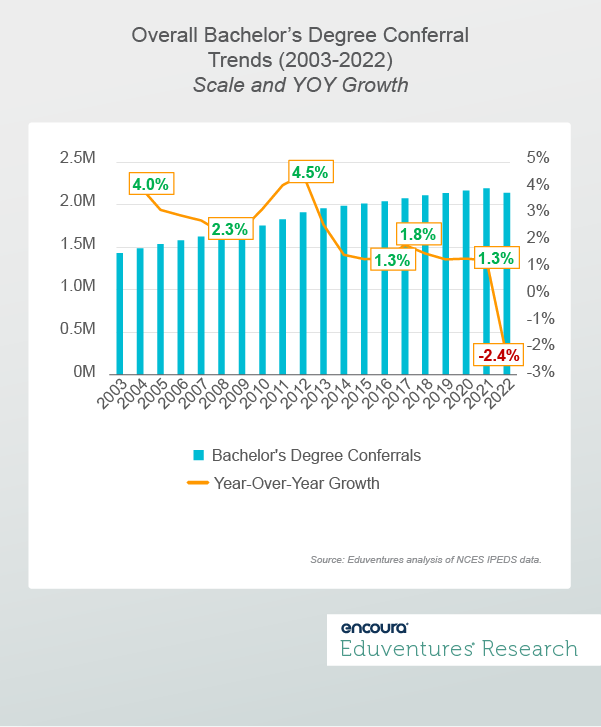
Figure 1.
What explains this shift? We posed three questions and explored the data through three different views below.
Question 1: Was the 2022 conferral decline driven by one specific age cohort?
The answer: No.
Based on the available age segmentation through IPEDS, bachelor’s conferrals declined in 2022 among both the adult bachelor’s cohort (aged 25 and over) and traditional bachelor’s cohort (aged 24 and under).
Bachelor’s Degree Conferral Trends by Age – The Last Decade
| Year | 24 Years Old and Under (Traditional) | YOY Change | 25 Years Old and Over (Adult) | YOY Change |
|---|---|---|---|---|
| 2013 | 1,193,353 | 35,448 | 618,805 | 23,069 |
| 2014 | 1,216,240 | 22,887 | 618,583 | -222 |
| 2015 | 1,239,093 | 22,853 | 625,969 | 7,386 |
| 2016 | 1,274,089 | 34,996 | 620,553 | -5,416 |
| 2017 | 1,314,207 | 40,118 | 616,496 | -4,057 |
| 2018 | 1,349,898 | 35,691 | 605,823 | -10,673 |
| 2019 | 1,382,278 | 32,380 | 605,109 | -714 |
| 2020 | 1,420,484 | 38,206 | 591,244 | -13,865 |
| 2021 | 1,431,540 | 11,056 | 608,963 | 17,719 |
| 2022 | 1,416,730 | -14,810 | 571,833 | -37,130 |
Figure 2.
The decline within the adult cohort is not a surprise when placed in context. Since the high-water mark in 2015, this market saw just one year of conferral growth. But the sheer scale of the 2022 decline is quite shocking: it’s almost three times the size of the next biggest decline in 2020.
On the other hand, traditional-aged bachelor’s conferrals saw year-over-year growth through 2021. The year 2022 represents the first drop over this period, and the first in recent history, making this development a surprise. Noticeably, the 2022 drop came after a year that saw positive, yet significantly slowed, growth.
The view above reveals that the 2022 decline was caused by both age cohorts.
Question 2: Was the 2022 conferral decline isolated within a specific school type?
The answer: Also no.
Figure 3 shows 2021 and 2022 bachelor’s conferral counts for Carnegie Classification categories with at least 1,000 reported bachelor’s conferrals in 2022.
Bachelor’s Degree Conferral Trends by Carnegie Classification (2021-2022)
| Carnegie Classification (ranked by 2022 scale) | 2021 | 2022 | 2021-2022 YOY # |
|---|---|---|---|
| Doctoral Universities: Very High Research Activity | 731,511 | 711,518 | -19,993 |
| Master's Colleges & Universities: Larger Programs | 435,299 | 420,784 | -14,515 |
| Doctoral Universities: High Research Activity | 338,057 | 326,452 | -11,605 |
| Doctoral/Professional Universities | 210,596 | 204,565 | -6,031 |
| Master's Colleges & Universities: Medium Programs | 86,427 | 82,527 | -3,900 |
| Baccalaureate Colleges: Arts & Sciences Focus | 69,411 | 70,527 | 1,116 |
| Baccalaureate Colleges: Diverse Fields | 69,576 | 68,670 | -906 |
| Master's Colleges & Universities: Small Programs | 51,889 | 49,758 | -2,131 |
| Special Focus Four-Year: Other Health Professions Schools | 27,576 | 27,650 | 74 |
| Baccalaureate/Associate's Colleges: Mixed Baccalaureate/Associate's | 14,165 | 13,672 | -493 |
| Special Focus Four-Year: Arts, Music & Design Schools | 7,639 | 7,750 | 111 |
| Baccalaureate/Associate's Colleges: Associate's Dominant | 6,580 | 6,738 | 158 |
| Special Focus Four-Year: Business & Management Schools | 5,675 | 5,315 | -360 |
| Special Focus Four-Year: Research Institutions | 5,294 | 5,019 | -275 |
| Special Focus Four-Year: Faith-Related Institutions | 4,814 | 4,565 | -249 |
Figure 3.
Of the 15 segments featured in Figure 3, 11 saw conferral decline in 2021-2022. This indicates that the conferral drop was quite widespread across institution type, with R1’s, M1’s, and R2’s reporting the largest conferral declines.
Question 3: Was the conferral decline limited to a handful of academic program fields?
The answer: Again, no. In fact, quite the opposite.
Of the 38 broad fields of study tracked by IPEDS, just 11 (29%) reported positive conferral growth between 2021 and 2022. This number shrinks to five if you count just those fields reporting a net gain of over 200 conferrals over these two years.
Figure 4 reveals these five growing fields.
Bachelor’s Fields Growing by at Least 200 Conferrals (2021-2022)
| Field (ordered by 2022 conferrals) | 2021 | 2022 | 2021-2022 # Change |
|---|---|---|---|
| Psychology | 133,239 | 136,515 | 3,276 |
| Computer and Information Sciences and Support Services | 108,823 | 112,659 | 3,836 |
| Visual and Performing Arts | 94,210 | 94,662 | 452 |
| Transportation and Materials Moving | 6,074 | 6,640 | 566 |
| Communications Technologies/Technicians and Support Services | 4,587 | 4,903 | 316 |
Figure 4.
The Bottom Line
These trends show that the 2022 bachelor’s conferral dip was widespread—spanning age cohorts, institution types, and fields of study.
So, what can explain it?
The COVID-19 pandemic is likely one explanation. The National Student Clearinghouse Research Center estimated that over 560,200 students left higher education between 2019 and 2020 causing a massive disruption to the degree completion pipeline. With conferrals offering a delayed demand metric, the steep pandemic-induced enrollment decline may just now be showing up as a steep adult and a first-time traditional bachelor’s conferral dip.
Research has found that most students who left higher education during COVID have considered reenrolling. If more of these students at the bachelor’s level return, this may be a short-term dip.
Longer-term enrollment trends, however, may also be at play. Consider that between 2010 and 2019, pre-pandemic, overall undergraduate enrollment fell from 18 million to 16.5 million. Additionally, from Fall 2018 to Fall 2021, first-time undergraduate enrollment declined 4% after growing since 2010.
On this front, National Student Clearinghouse data reveals continued erosion with freshman enrollment down by almost 4% between fall 2022 and fall 2023. Certainly, if these trends hold, we may see the beginning signs of the enrollment cliff showing up in conferral data.
These trends will be worth tracking to determine if 2022 is indeed the start of a long-term trend or just a flash in the pan.
