Sometimes you just know. Whether it’s the love of your life, the career you will pursue, or simply the sweater you see at the store: when it’s right, you just know. Or at least you think you know… long enough to take the plunge.
This phenomenon is also present among some college-bound high school students. While the average number of schools students apply to has steadily risen in recent years, there are still those who put all their eggs into one basket.
The Practitioners and The Academics
The Eduventures 2018 Survey of Admitted Students™ uncovers several factors that play a role in how students hedge their bets in the admissions game. The first connection is between the number of application schools and desired academic major.
Figure 1 shows the number of schools students applied to for the 2018/2019 academic year broken out by a selection of major choice. Overall, 13% of respondents told us they applied to only one school.
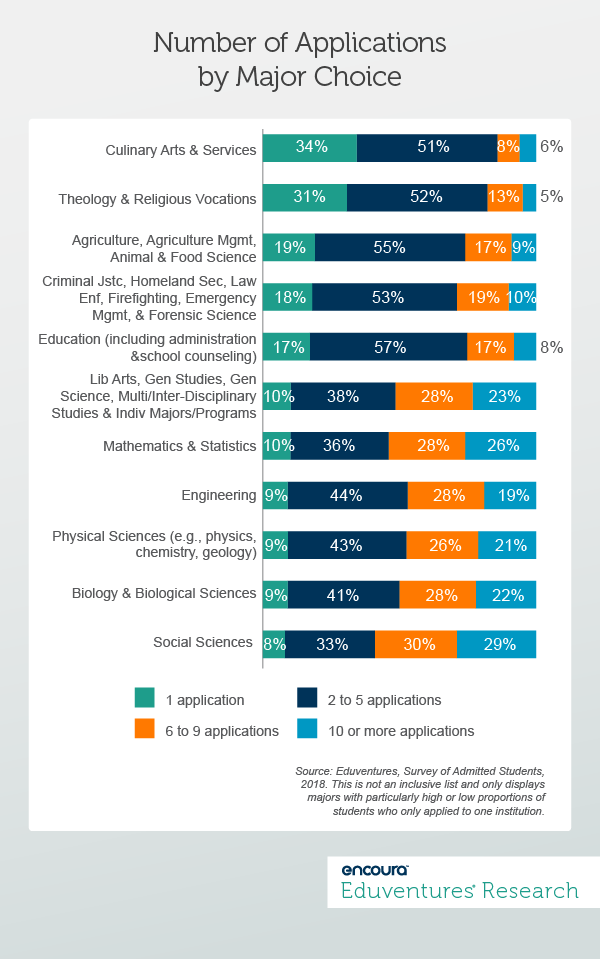
It is interesting to see that about a third of students interested in studying culinary arts or theology say they applied to only one school. On the other side of the spectrum, students interested in the social sciences are particularly likely to shop around: 29% applied to 10 or more schools and only 8% were so sure of their choice and applied to one institution. Students interested in STEM fields are also quite likely to apply to a larger number of schools.
The pattern we see with this list suggests that, with the exception of engineering, students who are interested in a major that is closely aligned to a career or vocation tend to apply to fewer schools. Students who want to pursue majors without a clear career path appear to cast a wider net.
Origins and Destinations
Two other dimensions also seem to influence how wide prospective students cast their nets. Figure 2 looks at the geographic location of students.
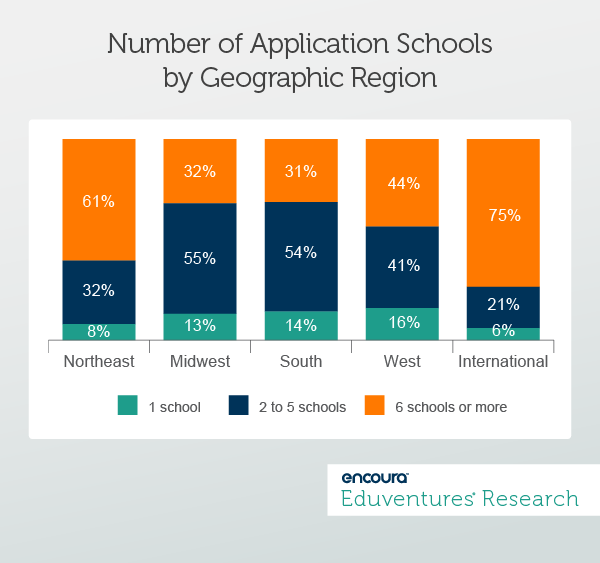
Students in the Northeast most often apply to six or more schools, making a market already grappling with demographic shifts even more competitive. More than half of students in the Midwest (55%) and South (54%) apply to a moderate number of schools (between two and five). International students appear to really want to increase their options: 75% say they applied to at least six schools.
In addition to the geographic origin of students, we found that the destination, or the type of institution at which students chose to enroll, is also related to the number of schools to which students apply (Figure 3).
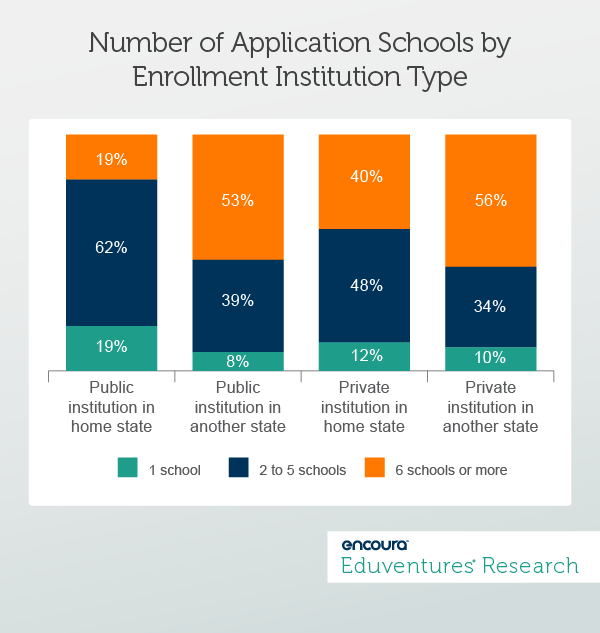
Students who ended up attending an in-state public institution least often applied to more than five schools (19%) and most often only applied to one school (19%). Students who chose to enroll at a private institution more often applied to six or more schools in the aggregate (49% vs. 32%).
But an interesting effect appeared when we took residence status into account. Regardless of institutional control, students who chose to attend a college outside their home state were the most likely to have applied to more than five schools. In fact, a notable difference in application school volume was only present among students who chose an in-state institution.
What’s Love Got to Do with It?
What drives students to only consider a small set of schools? Is it the confidence they will be accepted at their dream school, or the reality of having few viable options? The connection between the number of applications and attending a first-choice school seems to indicate the former.
Figure 4 shows that the percentage of students who say they attend their first-choice school drops significantly as the number of applications increases.
Number of Application Schools and Attendance of First-Choice School
| 1 application school | 2 to 5 application schools | 6 to 9 application schools | 10 or more application schools | |
|---|---|---|---|---|
| Attend their first choice | 96% | 85% | 75% | 69% |
It appears that the concept of a “first-choice school,” while emotionally charged, may have more of a pragmatic origin than many think. Perhaps love has little to do with it. A student who only looks at a small number of schools must be sure to have a good chance of acceptance at these schools. Students who apply to in-state public institutions are often affordability-driven, but they also seem very certain about their odds of acceptance.
The Bottom Line
While no student is a safe bet until they step foot on your campus in the fall, you may just have to compete a bit harder for some students than for others. Chances are you have a steady base of students who are genuinely excited about your institution—your bread-and-butter students so to speak—but maybe you are chasing that elusive pool of out-of-state applicants who just won’t convert as easily. If you understand your prospective student pool and how their individual consideration sets may differ based on their backgrounds and interests, you may just have better odds of finding and admitting the students who truly want to be at your school.
Knowing what students care about when they are making their final enrollment decisions is vital to creating a relevant yield strategy. As we look around the corner to Fall 2019 admitted freshmen, now is a great time to learn how specific types of admitted students make their decisions. Doing so will allow you to refine and tailor your next recruitment cycle and yield strategy to meet your goals.
This webinar will cover highlights from Eduventures® Survey of Admitted Students™, an annual study that collects data from more than 100,000 admitted students to help colleges and universities design effective yield strategies. Insights from this webinar will help you to:
- Identify key student Decision Segments™
- Understand where non-enrolling students actually did enroll and why
- Better assess and respond to the competitive landscape