
Bachelor’s programs have exploded in recent years. Between 2012 and 2020 alone, the market experienced a net gain of 7,749 bachelor’s programs across 38 broad fields of study according to NCES IPEDS data. That’s almost 1,000 new programs per year!
New program development is healthy, and necessary, for institutions to stay competitive, attract students, and anticipate new labor market needs, but, as Eduventures’ Chief Research Officer Richard Garrett has said, “the problem is that programs have grown faster than enrollment, particularly at the bachelor’s level, implying flagging productivity and bloated portfolios.”
What does this mean for schools and how should they address it?
The Rising Program Tide
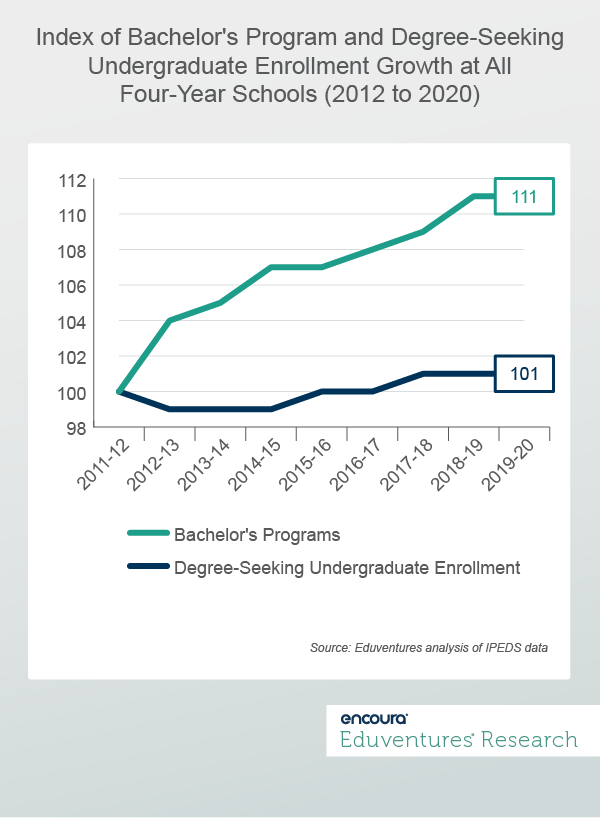
Between 2012-2020, bachelor’s programs at four-year schools grew by 11% to just over 79,000 programs in 2020. At the same time, degree-seeking undergraduate enrollment at these schools only grew by 1%. Figure 1 contrasts these trends at all four-year schools.
If bachelor’s program growth continues on its current pace and the challenged enrollment environment seen over recent years continues to be exacerbated by COVID-induced pressures, It’s no wonder why 69% of those surveyed in Inside Higher Ed’s 2021 Survey of Chief Academic Officers and Provosts reported “cutting underperforming academic programs” as a post-pandemic priority.
This is where a stronger understanding of market efficiency becomes particularly valuable. Enter a market with conferrals on the decline and risk launching a program with waning student interest. Enter a market with growing conferrals, but faster program growth, and risk launching a program in an increasingly competitive and potentially saturated market. Tracking conferrals without accounting for programs paints an incomplete picture. But looking at both metrics together—through the lens of market efficiency—provides a powerful understanding of market health and opportunity.
Eduventures defines efficiency through two metrics:
- Absolute Efficiency is the number of bachelor’s degree conferrals per program in a field of study in 2020.
- Efficiency Over Time is the change in bachelor’s degree conferrals per program in a field of study from 2012 to 2020.
These efficiency metrics provide a measurement to quickly assess how growing or shrinking programs and conferrals are dragging down or boosting a particular program market’s productivity.
Let’s look at an example. Table 1 displays four sample fields of study ranked by the net gain of bachelor’s programs reported along with degree conferral trends in those fields during the 2012-2020 window.
Table 1. Bachelor’s Program and Conferral Growth for Four Fields of Study
| Field of Study | Program Growth # | Program Growth % | Conferral Growth # | Conferral Growth % |
|---|---|---|---|---|
| Visual and Performing Arts | 739 | 10% | -3,437 | -3% |
| Engineering | 611 | 26% | 47,498 | 59% |
| Social Sciences | 312 | 6% | -5,058 | -3% |
| Natural Resources and Conservation | 225 | 22% | 6,047 | 39% |
Source: Eduventures analysis of IPEDS data
These four fields of study have one thing in common: they all saw new programs enter the market during the examined timeframe. They diverge, however, when it comes to conferral growth. The fields of engineering and natural resources and conservation enjoyed strong demand that outpaced supply, while visual and performing arts and the social sciences saw supply that outpaced weakening demand.
Viewing this data as it is provides a general understanding of these markets. But looking only at conferral and program change doesn’t provide us an actual measurement of how supply and demand has influenced market performance. Market efficiency metrics do this and allow us to compare specific fields of study to the overall market, placing these markets in context.
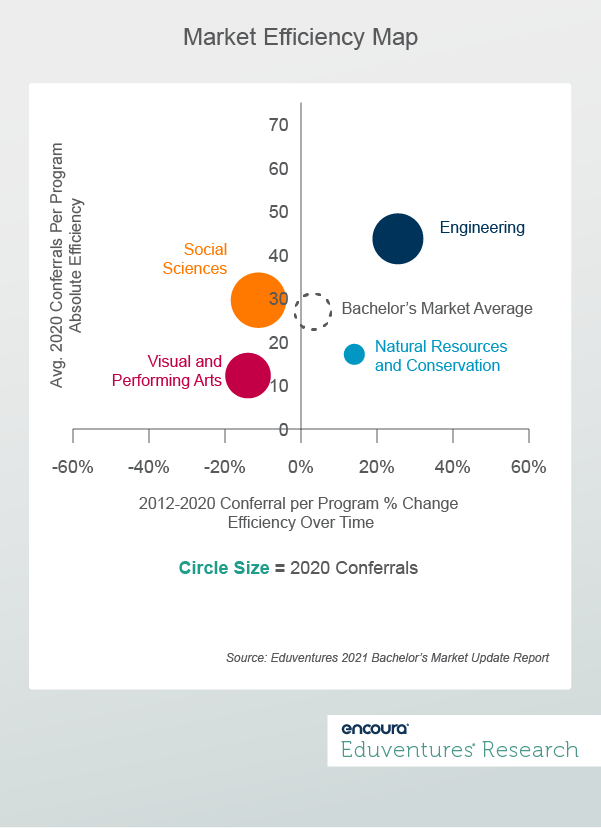
The overall bachelor’s program market average is represented by the dashed circle near the middle of Figure 2. Here we can observe that bachelor’s programs, on average, reported 27 degree conferrals in 2020 (y axis). And, despite the troubling program and enrollment trends detailed in Figure 1, the overall bachelor’s market indeed became 2% more efficient between 2012-2020 (x axis)—this is likely given increased focus and energy around degree completion efforts, but overall efficiency will be challenged if current trends continue.
The overall program benchmarks also place each field in separate quadrants that help explain market health and opportunity:
- Engineering (high Absolute Efficiency and positive Efficiency Over Time) - An extremely efficient market outpacing the market average in efficiency over time (26% increase in conferrals per program vs. an overall bachelor’s market average of 2%) and absolute efficiency (44 conferrals per program vs. a market average of 27). This is a favorable market for continued investment or new program launch.
- Natural Resources and Conservation (low Absolute Efficiency and positive Efficiency Over Time) - An increasingly efficient market; efficiency over time saw a 14% jump. But absolute efficiency remains below average (17). This market is on the rise in terms of favorability where programs have seen smaller but growing cohorts.
- Social Sciences (high Absolute Efficiency and low Efficiency Over Time) – A market decreasing in efficiency. While its absolute efficiency remains above the market average (30), efficiency over time fell by 9%. This market provides some pause for expansion as current trends would drive cohort sizes down further.
- Visual and Performing Arts (low Absolute Efficiency and low Efficiency Over Time) - An inefficient market. Not only has this market decreased in efficiency over time (-13%), but its absolute efficiency is also less than half the market’s average (12 vs. the market average of 27). New entries and current programs may be challenged in this space unless schools can offer a secret sauce for distinction.
The Bottom Line
Measuring efficiency adds a meaningful component to assessing the long-term viability and sustainability of a program market, providing a more complete picture than conferral and program trends alone. This Wake-Up Call, however, only scratches the surface of our analysis on bachelor’s market efficiency. The recently-published Eduventures 2021 Bachelor’s Market Update Report, available on the Encoura platform, provides greater detail plotting all fields of study on the Market Efficiency Map, and providing our take on what is driving market efficiency gains and how efficiency metrics play into assessing current and new program opportunities.
Critically, the report explores, in greater detail, what placement on the efficiency map signals in terms of the most healthy and promising program markets versus those that might provide pause in strategic discussions.
Never Miss Your Wake-Up Call
Learn more about our team of expert research analysts here.
Eduventures Senior Analyst at Encoura
Contact
The Program Strength Assessment (PSA) is a data-driven way for higher education leaders to objectively evaluate their programs against internal and external benchmarks. By leveraging the unparalleled data sets and deep expertise of Eduventures, we’re able to objectively identify where your program strengths intersect with traditional, adult, and graduate students’ values so you can create a productive and distinctive program portfolio.
Wednesday January 26, 2022 at 2PM ET/1PM CT
As we kick off a new semester, it's a great time to remember one of your most important stakeholders: alumni. What new strategies do you have for this upcoming semester to engage with your alumni in a refreshing and personal way that reminds them of their pride for your institution?
In this webinar, VP of Encoura Digital Solutions Reva Levin and Director Lyndenise Berdecía will share why an omnichannel approach is the most effective way to connect with alumni and drive genuine giving. They’ll also describe how and when to implement this approach in order to help any institution have a more successful giving season.
Tuesday, February 1, 2022 at 2PM ET/1PM CT
Current students, alumni, faculty, and staff are some of your institution’s most influential brand ambassadors. What if you could discover prospective students connected to these key influencers using data you already own? Affinity Connection™ (formerly Legacy Student Locator) makes it easier than ever to find students associated with your key constituents – now within the Encoura platform.
In this webinar, we’ll show you how Affinity Connection will help you:
- Find the latest matches with more frequent data matching, processing, and delivery (now weekly updates)
- Visualize and track the success of your Affinity Connection campaign in Enrollment Lens®
- Quickly upload, select, and export match data in Encoura
Join the Encoura team on Tuesday, February 1st at 2pm ET/ 1PM CT to see firsthand the evolution of the former Legacy Student Locator program to the upgraded Affinity Connection program.
