June 14-16, 2023
Intercontinental Boston–Boston, MA
As has become an end-of-year tradition at Eduventures, we ask our team to reflect on something specific they learned through their research over the past year.
Click the author to jump to each section:
- Credential Trends are Changing – Richard Garrett, Chief Research Officer
- How to Win Back Enrollment Lost to COVID – Kim Reid, Principal Analyst
- Two Kinds of Transfer Students – James Wiley, Principal Analyst
- Emailing Prospects Earlier is Better – Johanna Trovato, Principal Analyst
- Beware of Bachelor’s Field Consolidation - Clint Raine, Senior Analyst
- Wanted: Better Data for Non-Degree Programs - Chris Gardiner, Senior Analyst
Credential Trends are Changing
By Richard Garrett
In 2022, I learned that the composition of the prospective adult-learner population has changed dramatically. It is commonplace to hear about the shifting, multifaceted nature of the traditional-aged college student. By contrast, adults are often presented simply as a monolithic “opportunity.”
Let’s focus here on credential trends. This is a vital perspective for schools that target adult undergraduates or graduate students.
Figure 1 shows the breakdown of U.S. adults aged 25-44—the period when most adult undergraduate and graduate enrollment occurs—by highest educational attainment over the past 20 years.
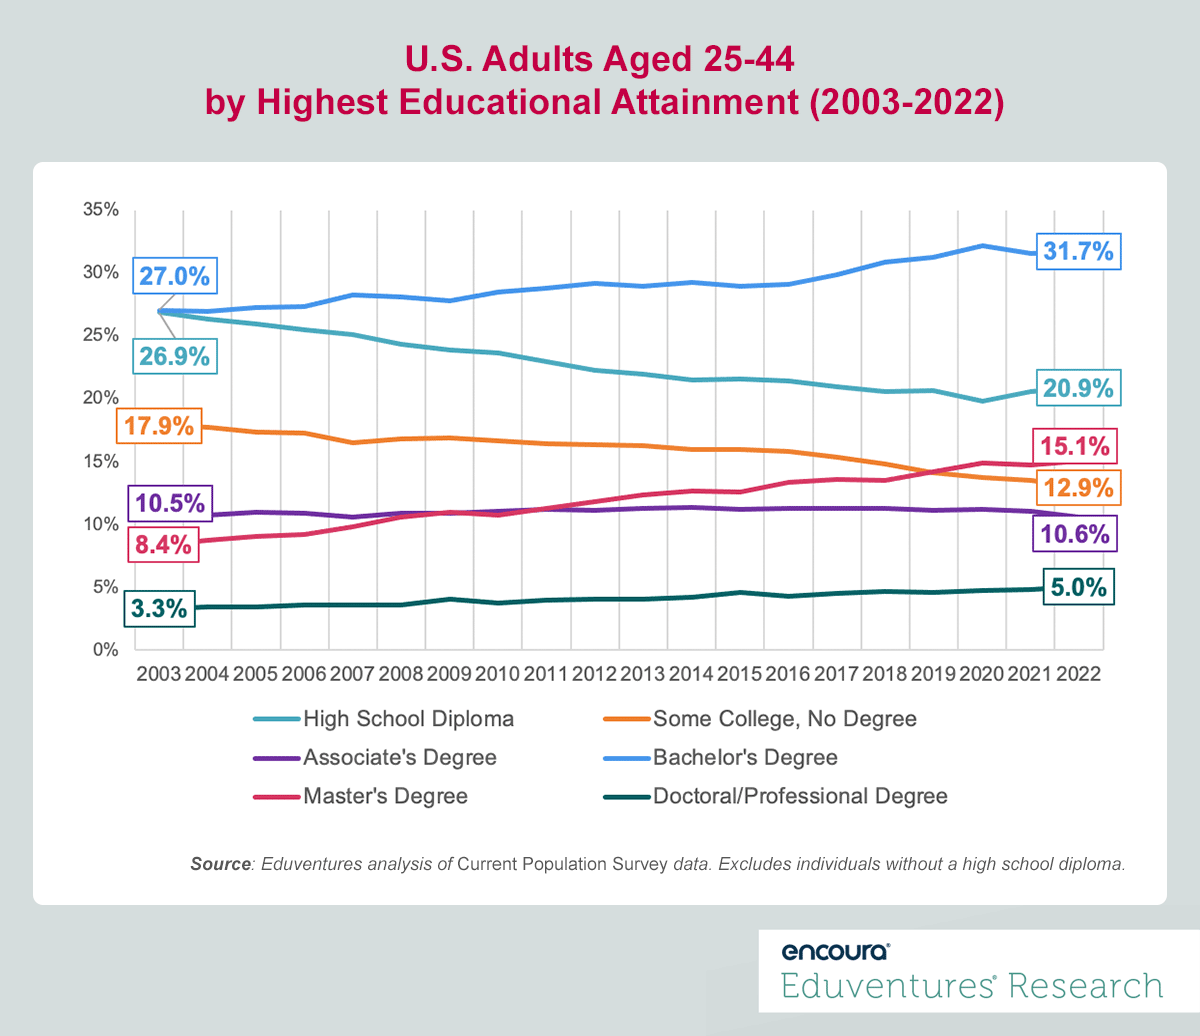
Figure 1
Back in 2003, 27% of adults in this age range had no more than a high school diploma and 18% had “some college, no degree.” By 2022, these ratios had fallen by a fifth and almost a third, respectively, evidence of higher education’s success at enrolling more students right out of high school and tempting more adults to return to college.
In 2003, there were nearly 15 million “some college, no degree” individuals aged 25-44 in America. Today there are fewer than 12 million. No wonder adult undergraduate and community college enrollment has tanked over the past decade.
The opposite is true for people with at least a bachelor’s or master’s degree. There were fewer than 23 million Americans aged 25-44 with no more than a bachelor’s degree in 2003. Now there are close to 29 million, a 27% jump. Americans with a master’s degree as their highest credential soared from seven million to over 13.6 million over the same period.
These trends help explain the boom in master’s degree programs, particularly online, over the past 10 years, plus the explosion of online non-degree programs aimed at professionals.
What is the lesson here? All the credentials in Figure 1 have a solid future, but underlying population and attainment shifts mean some credentials are in the ascendant and others shrinking, resulting in new market configurations. Institutions can either take advantage or miss the big picture.
How to Win Back Enrollment Lost to COVID
By Kim Reid
In 2022, I learned that the students we lost from the college-bound pipeline during COVID can be identified not only by their demographics, but also by their desired pathway through college – they are career-focused access students.
Over the course of the pandemic, we’ve seen a significant decline in the number of access students in the enrollment funnel (i.e., first-generation, low-income, and underrepresented minority). Specifically, there are 20% fewer first-generation students, 11% fewer underrepresented minority students, 7% fewer middle-income students and 3% fewer low-income students. Colleges are rightly concerned about reconnecting to these demographic groups.
But the path toward reconnection is not merely about demographics, it’s also about the desire that students have for the future. This loss of students has led to a change in the composition of Student Mindsets™: pre-pandemic, the top three Mindsets for college-bound first-generation students were Career Pragmatist (35%), Experiential Interests™ (18%), and Social Focus™ (16%). Post-pandemic, the top three are Social Focus (22%), Grad School Bound™ (21%), and Exploration and Meaning™ (17%).
Figure 1 shows the dramatic pandemic era changes in Mindset for first-generation, low-income, and underrepresented minority students.
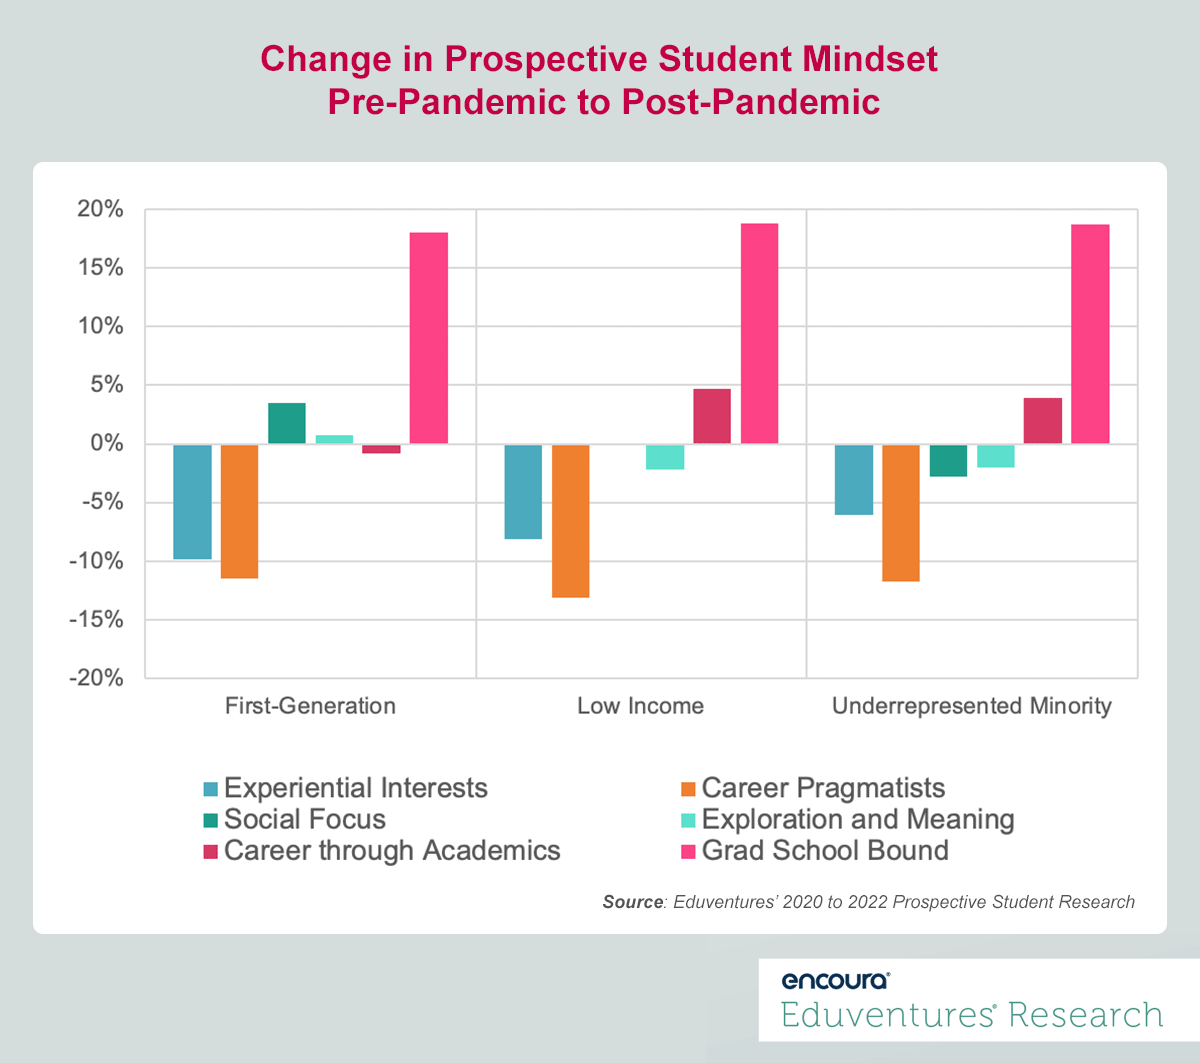
Figure 1
Figure 1 shows that the lost access students are Experiential Interests and Career Pragmatists—both Mindsets focused on career and affordability. Those who remain are much more likely to be Grad School Bound or to be focused on making friends or finding meaning in their lives.
The story this tells is that the access student with strong academic aspirations sees college as the path to success. The access student who is seeking an affordable career pathway is rethinking college as the pathway to career – it’s expensive, and perhaps the career connections aren’t all that clear. If we also take into consideration the strong job market, the value proposition of college is weak for this group of students.
Institutions must try to reconnect with this particular type of student. To do so, colleges must focus on the specific academic areas of interests for career-interested access students (like health professions and business). These programs should feature students of color, students from low-income households, or first-generation college students explicitly finding a pathway to a career.
Most importantly, programs must be affordable. For many students, the greatest competition for these programs is the job market, not other institutions. Students are deciding between paying tuition and earning an income, not between paying this tuition or that tuition.
The big question is whether this connection to career-focused access students is permanently broken or whether it can be rebuilt. The institution that develops affordable program-level value for these students will have the best chance at reconnection.
Emailing Prospects Earlier is Better
By Johanna Trovato
In 2022, I learned—or rather, confirmed—that email is still a highly relevant communication channel in Gen Z college search according to Eduventures' Student Sentiment Research™. Most prospects agree that email was most useful when they first started their searches (69%); 55 percent believe email is the best source of communication when they narrow their lists of potential application schools; and 50% of high school seniors say that email is the best source of communication in their enrollment decisions.
But not only do students generally express a preference for email when first learning about potential schools, sophomores are more likely to be impressed with email outreach they received from an institution than juniors and seniors.
When we asked students whether they recalled a specific school whose communication had grabbed their attentions, 71% of sophomores, 75% of juniors, and 67% of seniors told us they did. According to Figure 1, 45% of sophomores recall a specific recruitment email that left an impression, compared to 40% of juniors and 39% of seniors. This indicates that sophomores are most enthusiastic about email communication, consistent with other findings indicating greater sophomore enthusiasm about recruitment outreach in general compared to older students.
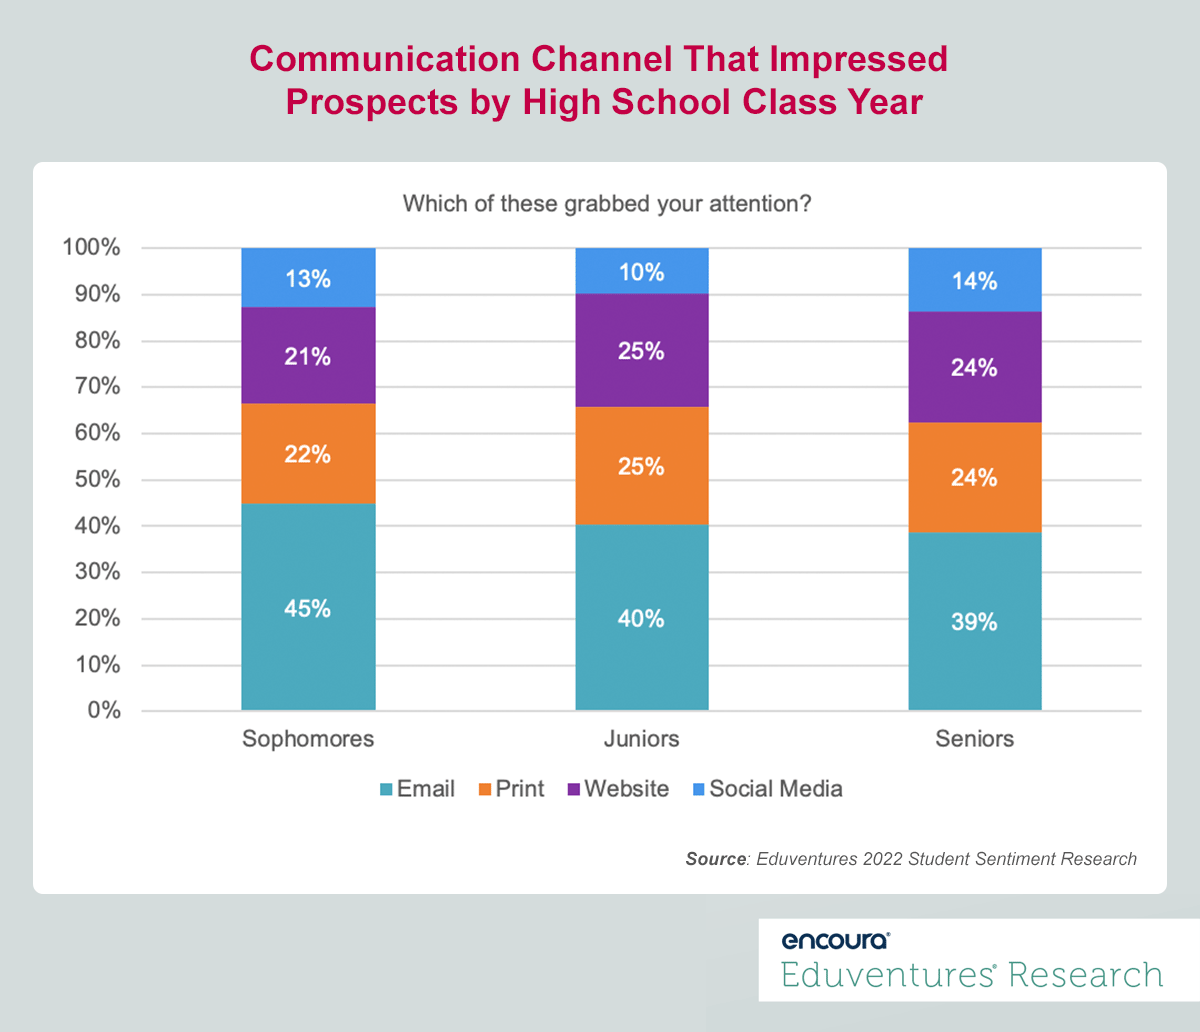
Figure 1
Notably, parents also tell us that they would like to hear from colleges early in the search process—the sooner institutions start communicating, the better.
Despite consistent sophomore enthusiasm for recruitment communication, many institutions, burdened with limited budgets and small staff, still only focus on the recruitment cycle at hand. At best, many start communicating with rising seniors in the late spring or summer. While this may be necessary to make the next class with limited resources, it is also a herculean effort because older students are less receptive to hearing from new institutions than younger students.
By neglecting sophomores, institutions miss out on the opportunity to make an important connection when students are most receptive. Considering the highly competitive recruitment environment we are in, emailing sophomores now could mean the difference between making or not making your class in the fall of 2025.
Beware of Bachelor's Field Consolidation
By Clint Raine
In 2022, I learned just how drastically the bachelor’s market has been reshaped over the last decade – spurred on by the strong growth of just a handful of fields of study.
Between 2012 and 2021, only five broad fields of study reported growth of over 25,000 bachelor’s degree conferrals: health (104,962), computer/information science (60,049), engineering (45,122), biological/biomedical science (36,027), and business/management (25,479). Combined, these fields reported gains of over 271,000 bachelor’s conferrals representing 97% of total bachelor’s market net growth during this period.
This has reshuffled bachelor’s market share with these top five growing fields claiming almost half (49%) of all bachelor’s degrees conferred in 2021 – up from 41% in 2012 as detailed in Figure 1.
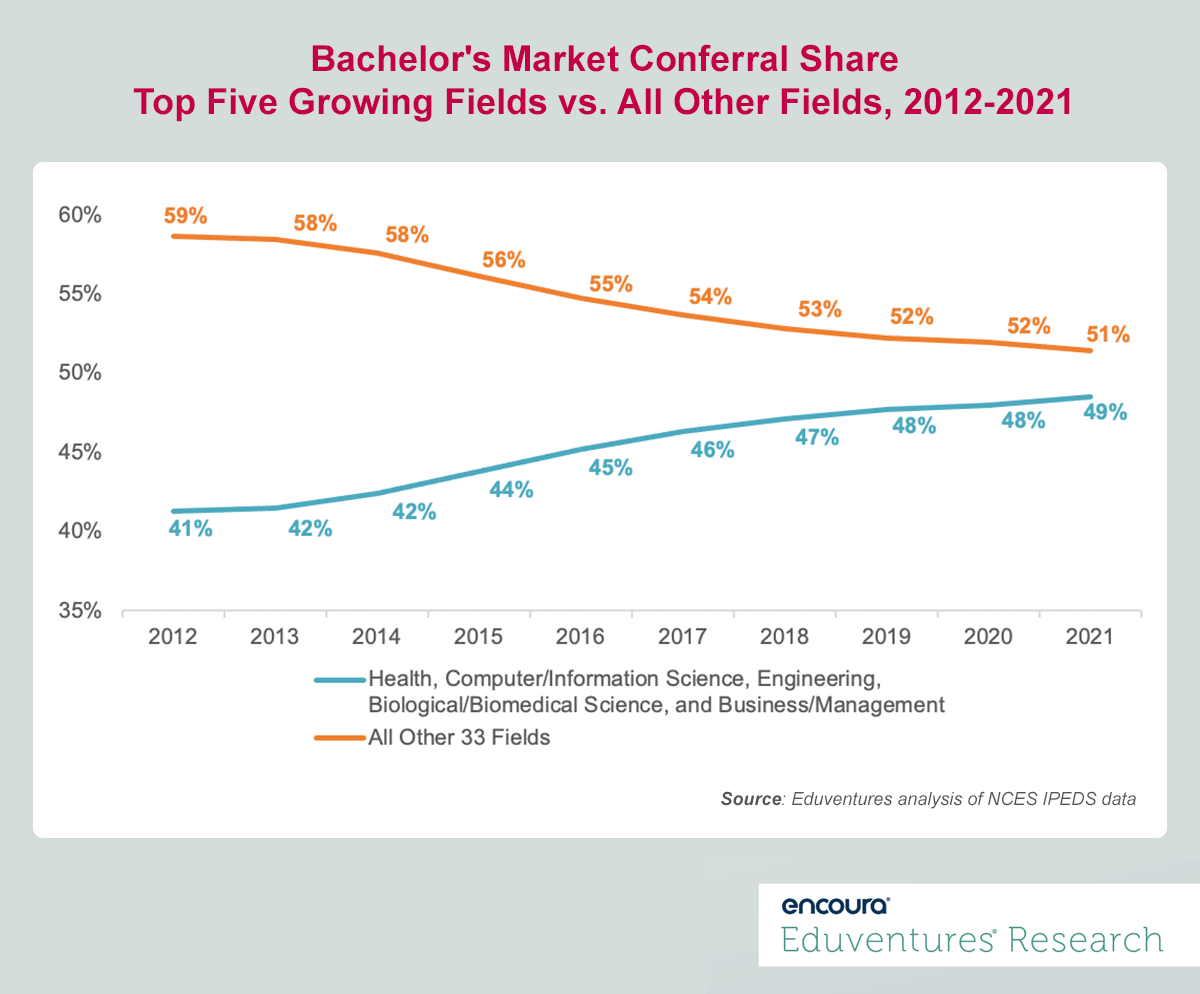
Figure 1
This is a critical trend for schools to internalize as they future-proof their program portfolios. Importantly, this bachelor’s market consolidation has been fueled by two main forces: the labor market and student preference.
On the former, these five fields offer clear career articulation, and, over the last decade when all jobs grew by 10%, bachelor’s occupations in business and financial operations (44%), management (42%), computer/mathematics (33%), healthcare (15%), and engineering (10%) all grew at or much faster than the average.
On the latter, prospective student interest in these five top growing fields has only strengthened. In 2022, 51% of all traditional-aged undergraduate prospects expressed interest in them – up from 46% in 2019 based on Eduventures' Prospective Student Research™. Not to mention that close to 60% of parents, major influencers on prospective students' decision-making processes, also report wanting their children to study in these fields according to our Prospective Parent Research™.
Sustained and growing interest in these fields suggests demand is not likely to soften. Which begs the question, how is your institution positioned in these markets?
With undergraduate enrollment on the decline and softening enrollment rates across key cohorts, offering top-of-mind programs with alignment to strong occupations will only become more critical. Of course, just launching new programs is not necessarily the answer, and any new rush of offerings could lead to market saturation.
To capture market momentum, the key is ensuring that programs in these markets are distinct and compelling while also working to build clear career connections and value propositions for programs that fall outside of the big five fields.
Two Kinds of Transfer Students
By James Wiley
In 2022, I learned that prospective transfer students who plan to transfer from two-year to four-year institutions fall into two distinct groups that differ in how they make their transfer decisions. While these two groups can be further broken into six specific transfer types, this simplified view may provide a helpful “shorthand” for those looking to sharpen their transfer strategies but who find the idea of catering to six different types daunting.
Based on Eduventures' 2021 Transfer Student Research™, Figure 1 shows that 68% of students, labeled “Directed and Feeling Supported,” have already decided to transfer. These students find advisors (41%) and friends and family (36%) to be the most helpful information resources.
On the other hand, a second set of prospective transfer students we’ll call “Concerned and Requiring More Information,” are awaiting further information before transferring, with the most significant percentage of students (57%) delaying their decisions until they have all the financial aid information. These students rely heavily on resources such as school-specific websites (32%) and online search engines (34%) to get information about four-year institutions.
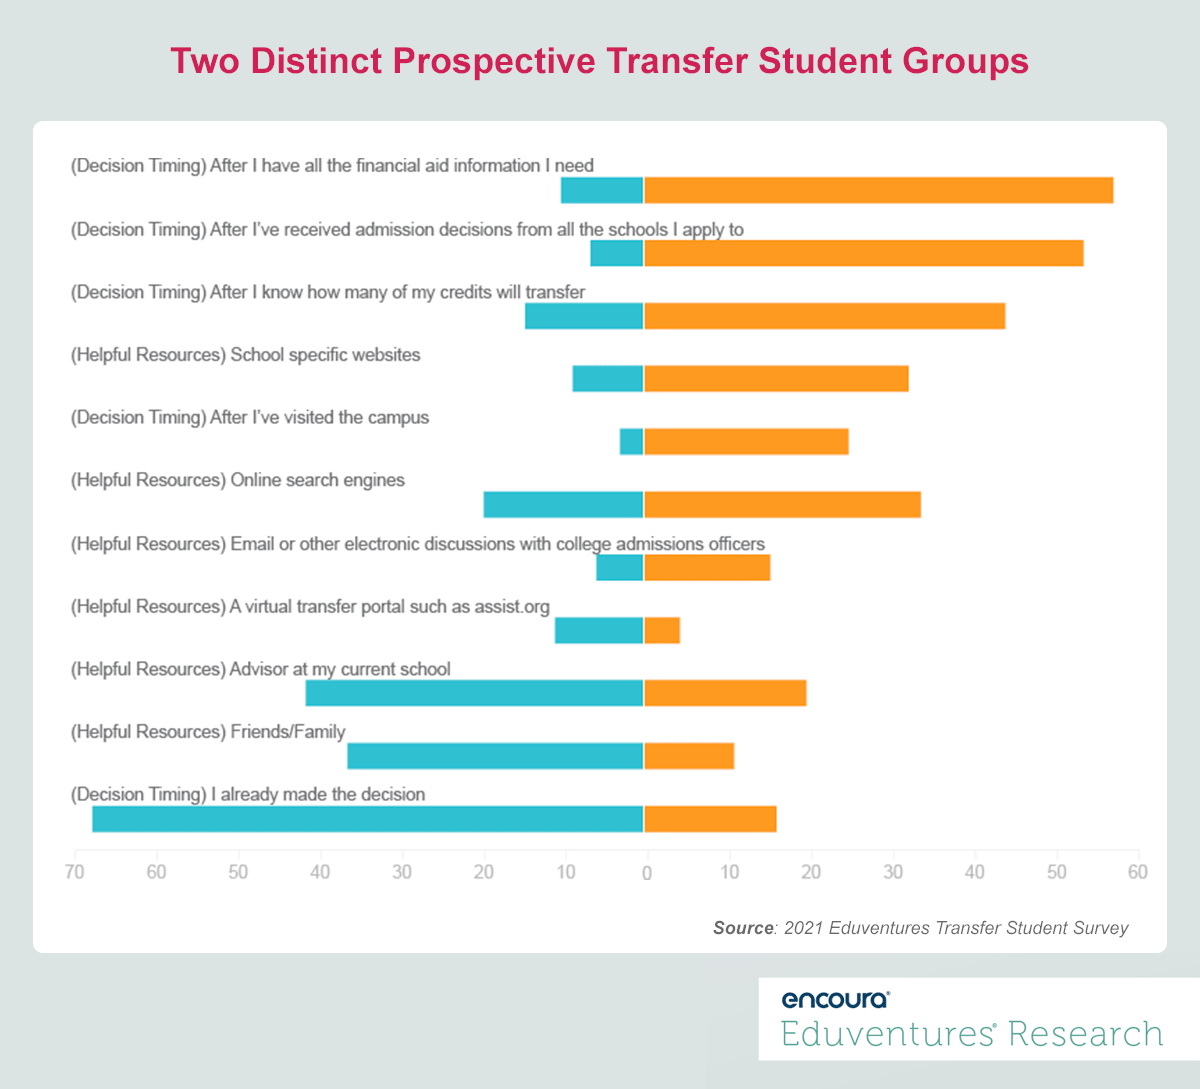
Figure 1
These findings are significant because they can further simplify our understanding of transfer student decision-making and cause us to rethink how we recruit transfer students. For example, rather than assuming that email communications and marketing are the best methods for all transfer students, we can now see that these approaches may not work well for those in the “Directed and Feeling Supported” group. Likewise, helping prospective transfer students understand their financial aid packages appears to be the method most likely to assist students who are “Concerned and Requiring More Information.”
Like college-bound high school prospects, transfer prospects are not monolithic. This data forces us to think of transfer student decision-making as more nuanced than we currently do, leading us to consider how best to reach out and support students through the decision-making process.
Wanted: Better Data for Non-Degree Programs
By Chris Gardiner
In 2022, I learned that non-degree programs (a.k.a. certificates) are not catalogued with the same rigor and detail as degree programs in IPEDS. This is, of course, not a new problem. In 2018 Eduventures' Chief Research Officer, Richard Garrett, noted that “certificate data leaves a lot to be desired.”
But fast-forward to 2022 and the market for these programs has exploded—there are an estimated 8,000+ university courses and certificates listed on the largest platforms of Coursera and edX alone.
To evaluate academic program trends—a common request from our clients—we often turn to IPEDS. With so many non-degree “programs” on these platforms, it seems like we should find some evidence of them there. In fact, to add clarity to this growing area, IPEDS divided the previous program category of “certificates of less than 1 year” into two new types: “less than 12 weeks,” and “12 weeks to one year.”
But doctoral and master’s-level institutions—the ones who created MOOCs and are driving non-degree interest—have been slow to embrace this new program designation. Figure 1 shows the proportion of certificate conferrals per level reported in IPEDS.
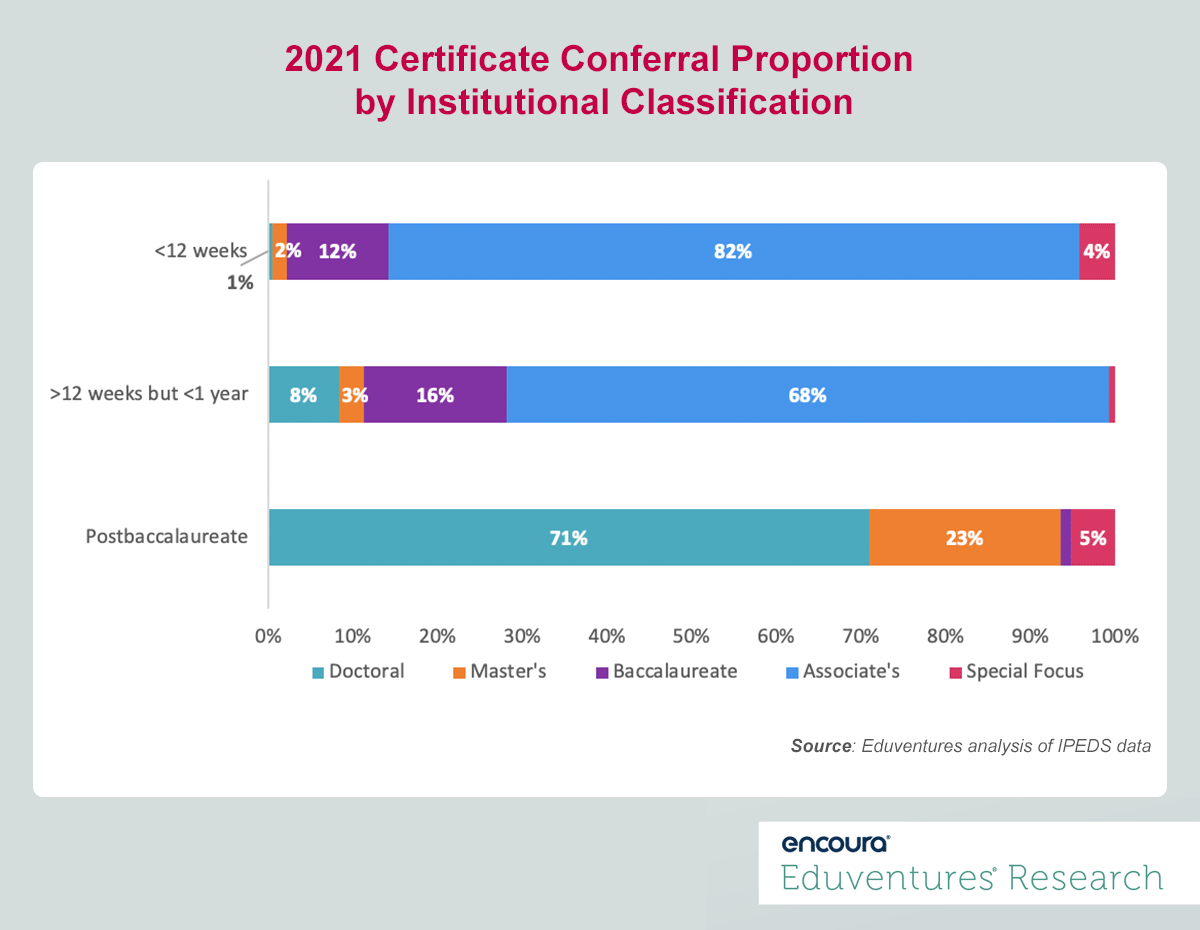
Figure 1
Notice that doctoral and master’s institutions accounted for just 3% of the 2021 “less than 12 weeks” certificates. Could this be because IPEDS classifies this category as sub-baccalaureate?
On the other hand, doctoral and master’s institutions conferred 11% (nearly 40,000) of all 2021 “12 weeks to one year” certificates —also classified by IPEDS as sub-baccalaureate—indicating that doctoral and master’s schools are not opposed to reporting sub-baccalaureate credentials. These institutions dominate the postbaccalaureate certificates credential, accounting for 94% of conferrals. But many non-degree programs we evaluate do not require a bachelor’s degree, which makes analyzing IPEDS data challenging.
There are a couple of reasons that non-degree programs go unreported. First, certificate programs typically do not qualify for Title IV funding, which is a major compliance task for institutional research offices. Also, some course-based programs do not technically “confer” anything—and thus do not rise to the level of reporting needs. This is all on top of the perennial challenge of overworked IR and registrar staff.
Given these institutional reporting and data challenges, it can be difficult for institutions wanting to grow non-degree programs and enrollment to figure out where to start.
In the coming months, Eduventures will be releasing a report on non-degree strategy that analyzes the leading online education platforms for market trends, including enrollment growth and financial viability.
Never Miss Your Wake-Up Call
Learn more about our team of expert research analysts here.
This recruitment cycle challenged the creativity of enrollment teams as they were forced to recreate the entire enrollment experience online. The challenge for this spring will be getting proximate to admitted students by replicating new-found practices to increase yield through the summer’s extended enrollment cycle.
By participating in the Eduventures Admitted Student Research, your office will gain actionable insights on:
- Nationwide benchmarks for yield outcomes
- Changes in the decision-making behaviors of incoming freshmen that impact recruiting
- Gaps between how your institution was perceived and your actual institution identity
- Regional and national competitive shifts in the wake of the post-COVID-19 environment
- Competitiveness of your updated financial aid model