
At the recent Eduventures Summit Virtual Research Forum, I presented an eye-popping chart showing the longstanding surge in higher education instructional and student services spend this century. Instructional spend at public four-year schools grew 140%, but student headcount climbed only 17% and graduation rates improved by only a few percentage points.
Tuition continues to rise not simply because per-student public funding has fallen over time, but also because schools are spending more per student, with questionable return-on-investment. Why do schools keep spending more?
COVID-19 dominates the discussion today, but long-term spending patterns will not go away. And greater spend is not the whole story: a significant minority of schools buck the trend—actually spending less per student over time.
Zooming Out
Figure 1 contrasts total instructional and student services spend since 2002 against student and faculty headcount. The chart concerns public four-year schools only, but similar trends could be presented for other types of institutions. Using 2002 as a baseline, the yawning gap between spend and headcount is obvious.
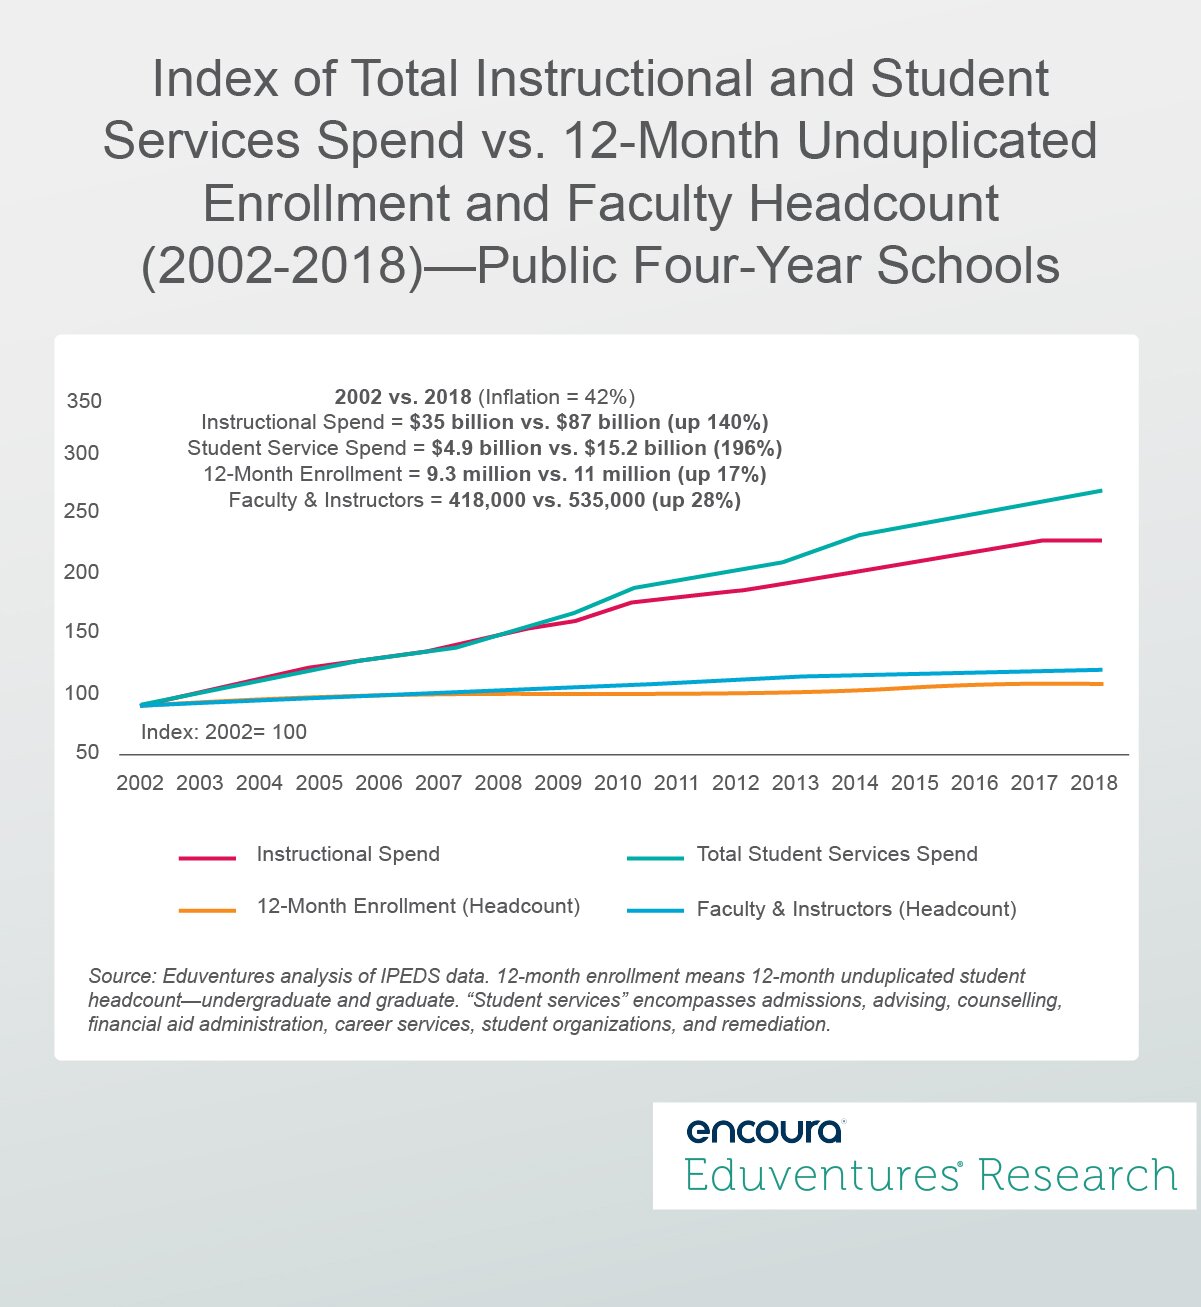
Let us take inflation out of the equation and compare constant dollars. In 2002, on average in 2018 dollars, public four-year schools spent $5,924 per student on instruction and student services, but spent $9,342 in 2018, a rise of 58%. Even since 2012, when the enrollment climate worsened, average spend per student climbed 13% above inflation.
Figure 1 details that instructional spend at four-year publics rose 140% since 2002 but faculty and instructor headcount only expanded 28% (and student headcount by only 17%). The share of instructional spend devoted to wages has remained essentially flat over the period so there is no simple technology substitution argument. But edtech spending is relevant.
Data from our partner LISTedTECH, a company that tracks educational technology adoption globally, reveals a steady year-over-year increase in instructional and student service technology implementations across North American higher education institutions this decade. Schools have certainly been spending more on edtech.
Wage increases are another part of the explanation. Net of inflation, average faculty and instructor wages at public four-year schools grew 32% between 2002 and 2018. This is in stark contrast to stagnant purchasing power for U.S. workers generally. Student services staff wages, likely also up, are hard to isolate in the data.
N.B. Media favorites such as climbing walls and lazy rivers, allegedly evidence of college waste and frivolity, fall outside the “student services” spend in Figure 1.
So more students, more faculty, faculty wage growth, and more technology explain at least half the instructional and student services spending increase. What about the rest?
Three external factors are at play:
- Competition: In much of the country, certainly over the past decade, schools have faced falling high school graduate cohorts and, during the record period of GDP growth that COVID-19 sent packing, depressed adult undergraduate demand. Trying to hit enrollment goals in a dwindling market persuaded many schools to invest in more programs, more services, more financial aid, and more marketing. Other helpful innovations have proven a double-edged sword: the Common App may be a boon for students, but has dramatically increased application noise for schools.
- Politicization: Higher education is caught in the culture wars as never before. The “left” demands ever-greater attention to diversity issues, while the “right” increasingly requires schools to combat allegations of institutional bias and reduced relevance. Keeping up with competing demands and challenges can be expensive.
- Social Safety Net: Growing socio-economic inequality in America, public service cut-backs, and increased higher education enrollment among less traditional populations has pushed many schools to do more to subsidize “basic” student needs, such as food, childcare, technology, and transportation.
Challenged on multiple fronts, many schools have attempted to spend their way out.
More research is needed to fully explain exactly what aspects of instruction and student services schools have been spending more money on, but the above analysis is a good start.
“Cost disease,” the notion that experience and people-oriented sectors, notably higher education, struggle with productivity gains and therefore tend to become more expensive over time, is no doubt also at work here. But some schools may be successfully combating this malady.
Zooming In
Individual schools depart from the spending average. Figure 2—focusing on the challenging enrollment period from 2012 to 2018—highlights an intriguing association between enrollment growth and lower spend per student.
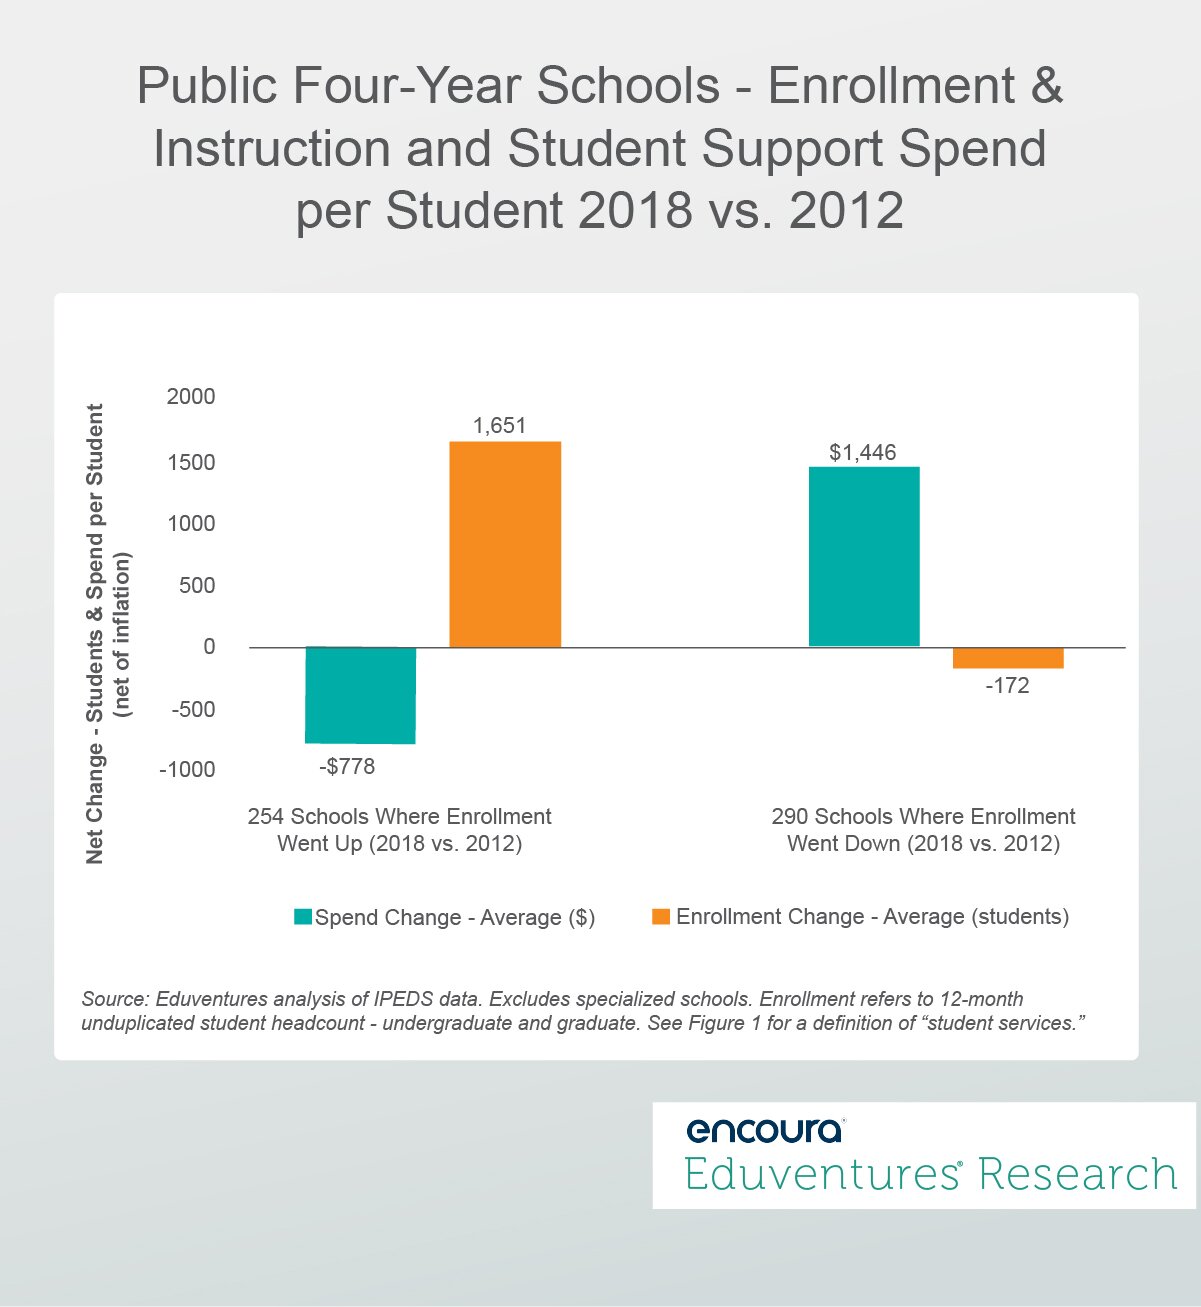
Public four-year schools that grew total student headcount in 2018 (vs. 2012)—an average increase of 1,651 students—also managed to reduce per student instructional and student services spend per student, net of inflation, by an average of $778. Schools that reported lower student headcount—an average loss of 172 students—posted mean spending gains of almost $1,500.
In short, on average, growing schools found economies of scale while shrinking schools attempted to spend their way to an enrollment turnaround.
The plot thickens. Despite boosting spending, schools with falling enrollments still lagged their expanding peers' spending by 16%—over $1,300 per student. Generally speaking, it is the better known and most prestigious schools that have grown enrollment this decade, at the expense of less-celebrated institutions. The former are typically oversubscribed, allowing enrollment expansion to manage market and funding constraints. This creates a virtuous circle for the prestigious, and a vicious circle for the rest.
The gap, however, is closing. In 2012, schools that went on to grow enrollment through 2018 devoted 26% more per-student on instruction and student services than the schools that would go on to lose enrollment over the same period. By 2018, the gap was only 16%.
The Bottom Line
The headline is important: in total, public four-year schools—and schools generally—are spending more each year per student on instruction and student services. It is hard to point to system-level ROI, such as student retention and completion, to justify such largesse. Competition, politicization, and a threadbare social safety net, along with edtech spending and “cost disease”, are driving this trend more clearly than demonstrable enhancements to student experience fundamentals.
But some schools have bucked the trend. Better branded schools, typically with superior per-student spend in the first place, have eked out economies of scale by dipping into their sizeable applicant pools and wait lists. Many institutions battling enrollment downturns are trying to spend their way out. Expect to see some schools take efficiency too far and suffer a reputational and enrollment hit, but expect to see others find a new “bigger spend-bigger brand” formula that pushes enrollment in the right direction.
The billion-dollar question is: are there schools that have not just won economies of scale but actually substantially lowered absolute instructional and student services costs and achieved significant quality gains? In a sector where instruction and student services spending growth per-student has outpaced every other metric, this is the real prize.
Never Miss Your Wake-Up Call
Learn more about our team of expert research analysts here.
Eduventures Chief Research Officer at ACT | NRCCUA
Contact
More Wake Up Calls
Never Miss Your Wake-Up Call
Learn more about our team of expert research analysts here.