
This is Part 2 of The College Enrollment Paradox. Read Part 1 here.
In part 1 of this series, we wrote about the 7% increase in college enrollment among public and private nonprofit four-year schools over the past decade despite a 10% decline in first-time, full-time undergraduate enrollment.
You might interpret the gains among four-year schools simply as quality schools accommodating a larger number of qualified students. But, is it more a case of lower admissions standards and compressed net price? And, are these larger freshman cohorts thriving or are retention rates going in the wrong direction?
Eduventures ran the numbers.
First, let us break down the 1,687 nonprofit four-year schools by enrollment trends. Figure 1 focuses on fall 2012 to fall 2017 (post-recession and the latest year when comprehensive data is available).
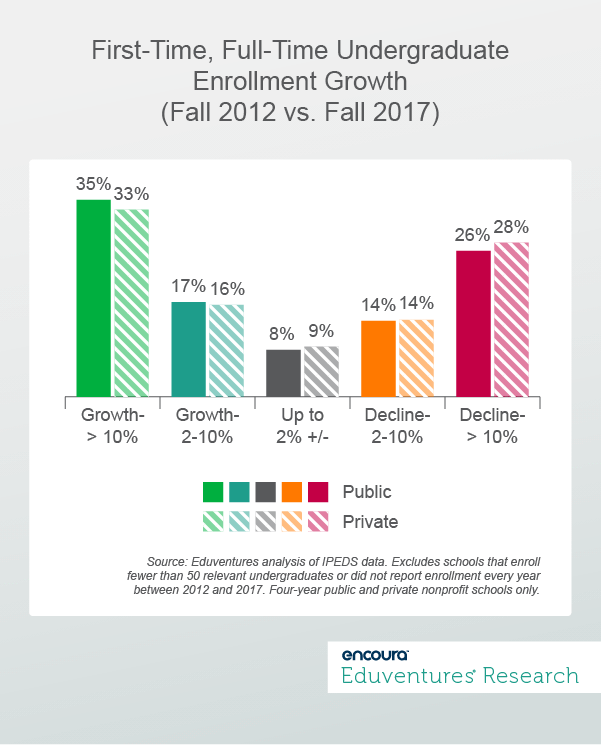
About a third of nonprofit four-year schools posted at least 10% growth, and 5% of publics and 7% of privates pushed past 50% growth. Steady-state pertains to about 8% of institutions, and about 40% saw some measure of decline. Generally speaking, public and private institutions are evenly distributed by growth rate.
But how are schools managing growth or the lack of it?
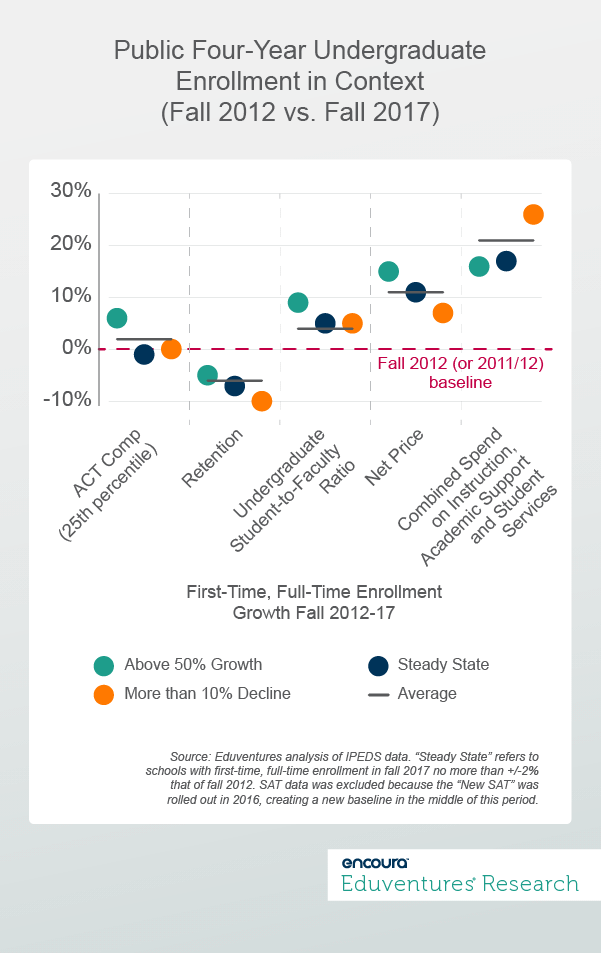
The next chart starts with public four-year schools, and compares enrollment growth to data that speaks to student preparation, the student experience, and institutional finances. This data offers useful—if partial—insight into what is going on at the institutional level. Figure 2 concentrates on the fastest-growth schools, the steady-state group, and those with the biggest declines.
How can we read Figure 2?
All variables are normalized to a fall 2012 baseline. This allows easier comparison of otherwise disparate data points. Starting with the public four-year institution average, first-time, full-time undergraduate enrollment growth to 2017 was 6%. Over the same period, the ACT Composite Score (25th percentile) average was up 2%. The average student-to-faculty ratio fell by 6%—meaning there were fewer students per faculty member, no doubt aided by the overall decline in first-time students nationally. Second year retention improved by 4%, net price grew 11%, and there was a 21% jump in spend per student on instruction and student support.
What about the four-year publics that grew enrollment fastest? Should we expect to see falling admission standards, lower net price, and more spending? In fact, the ACT score gain for this group was better than average (6%), faculty hiring meant fewer students per faculty member over the period, and retention gains beat the rest of the sample. Net price rose faster than elsewhere (15%), and average spend per student on instruction and support grew least (17%) but was still up more than net price.
This suggests that many of these fast-growing four-year publics are spinning a virtuous circle. Enrollment growth gets attention, which drives higher quality applicants (at least as measured by test scores). These institutions, on average, can command larger price increases, which affords more money for instruction and support, boosting retention and enhancing brand, and starting the cycle all over again. Perhaps these schools are winning students oriented toward private colleges, boosting ability to pay but also expectations. To counter price hikes, some public flagships are offering free tuition for strong in-state students from low income households.
By contrast, the four-year publics that lost more than 10% of first-time, full-time undergraduate enrollment between 2012 and 2017 exhibit the opposite situation. Falling enrollment meant limited ability to raise prices; this group saw the smallest average net price increase. These institutions, nonetheless, splurged on instruction and student support spending (up 26%), further pushing down the student-to-faculty ratio—but saw only average retention improvement. The ACT composite score for these schools was flat.
Figure 3 sets out the same data for four-year private nonprofit schools.
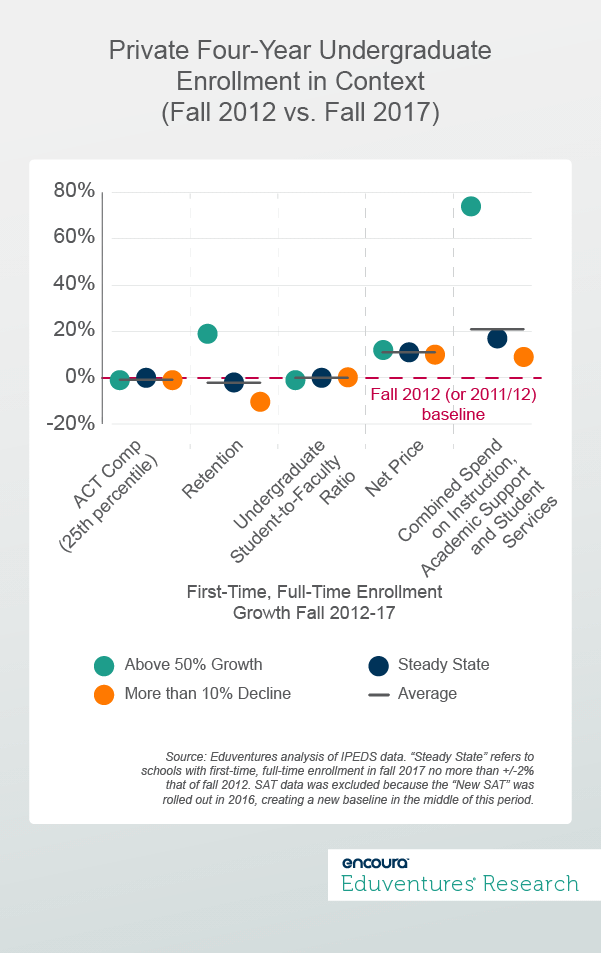
The story is somewhat different for private institutions. The fastest growing privates have, on average, made trade-offs. More students has meant more students per faculty member, despite much higher spend per student on instruction and support. Technology and non-faculty staff may be the object of this increased spend. Despite extra resources, retention is down, if only slightly. The net price boost is slightly better than average, but far adrift of increased spending.
Private colleges characterized by enrollment declines of more than 10% over the period have been attempting to hold the line. Net price is up in line with the average for the sector, and above spending growth. The fact of fewer students per faculty may simply reflect declining enrollment.
Private schools that kept enrollment steady generally performed in line with the average, acknowledging an often a superior starting point. Some schools, with low admissions rates, choose to hold enrollment constant, from a position of strength. Schools like Harvard, Yale, and Williams College are in this category. But it is striking that even these privates exhibit faster average instruction and support spending growth per student than net price gains. Endowments and lucrative graduate programs help cover the gap, but there is no room for complacency at the top.
Consistent with a strengthening economy, the ratio of undergraduates with a Pell Grant fell (slightly) between 2012 and 2017, from about 40% to 36%. There are no clear patterns by institutional enrollment growth profile.
The Bottom Line
This WUC underlines that enrollment does not operate in isolation. Analysis must consider factors such as student characteristics and preparedness, pricing, spend, and retention if the impact of enrollment gains (or losses) are to be fully understood over time.
Recent years have seen some prominent—and some not-so-prominent—institutions ride out demographic and funding volatility by steadily growing their freshman classes, sometimes at the expense of other schools without the leadership, strategy, or resources to compete. Based on our analysis of available data, some of these rapid-growth schools are successfully balancing enrollment growth with student support and retention. On the defensive, many schools with declining enrollment are trying to enhance their student experience so they can turn the corner. Paying attention to student support may see a retention win, giving the institution a better story to tell and affording more resources to devote to marketing or financial aid.
It is true that many of the fast-growth group began the period with relatively fewer first-time, full-time students, and many reported below average numbers on other metrics. Enrollment growth means normalization, which will test whether outperformance can be sustained.
A future Wake-Up Call will go one level deeper, examining the trajectories of specific institutions: those that have grown enrollment and improved other metrics, but also those who look healthy on the enrollment line but less so elsewhere. Similarly, institutions that have experienced flat or declining first-time, full-time enrollment will be highlighted, including what other metrics reveal about school strategy.
If we are to really understand current trends in higher education, we need to look at institutions holistically.
Thursday, October 24, 2019 at 2PM ET/1PM CT
- How do prospective adult learners make decisions regarding their educational futures?
- How can institutions and service providers better understand and anticipate the behaviors of prospective adult learners?
Thank you for subscribing!
Thank you for subscribing!
