With additional contributions from Richard Garrett, Eduventures Chief Research Officer at ACT | NRCCUA, and Clint Raine, Eduventures Client Research Analyst at ACT | NRCCUA.
The typical vision of the student journey is a single, seamless trajectory, beginning at admission and ending with graduation. In reality, it is more like a highway full of roadblocks and traffic jams. Unfortunately, the cost of adopting the typical view can be high for many schools, blinding them to problems students face in their institutional interactions and how these problems impact enrollment, persistence, or the student experience.
To better represent the reality of student experiences and reshape these experiences from a student perspective, some schools are borrowing a concept pioneered by the corporate world called customer journey mapping—or in the case of higher education, .
Our Research
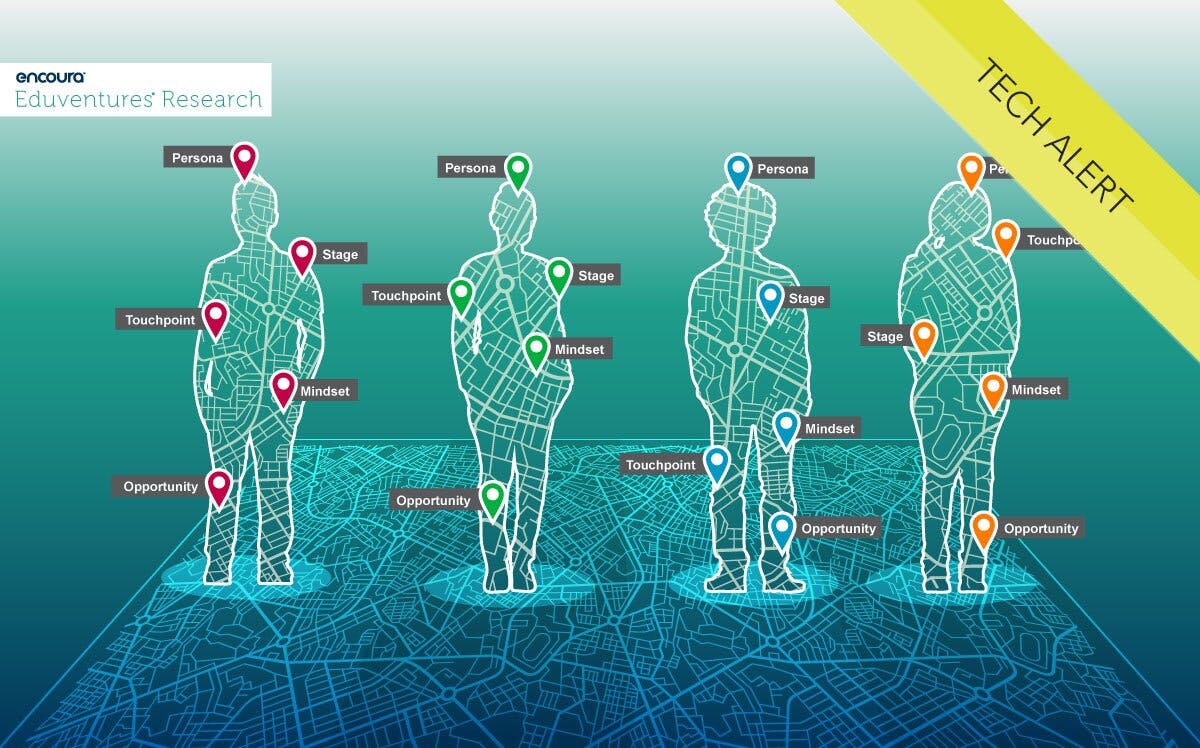
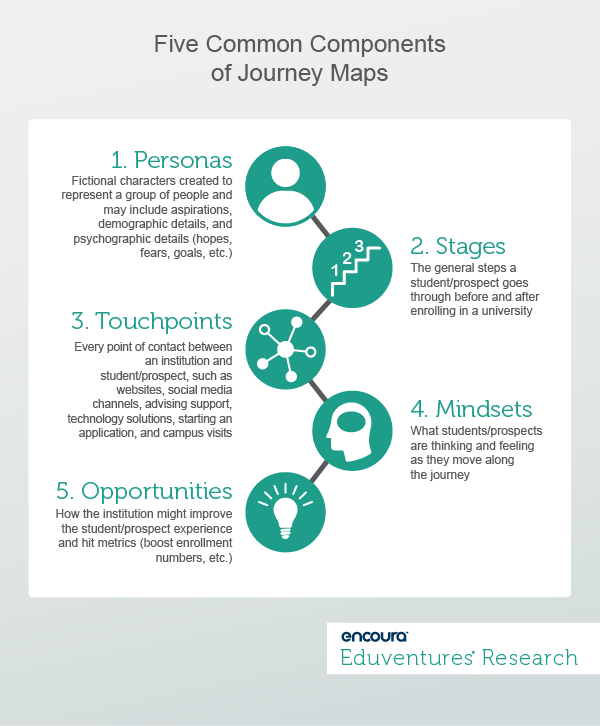
Journey mapping is not a novel approach: organizations such as Emirates Airlines have deployed journey mapping to ensure all staff members understand what's expected of them with each customer interaction and illustrate the relationship a customer has with the airline. Overall, most journey maps comprise five components —personas, stages, touchpoints, mindsets, and opportunities—which enable stakeholders to illuminate the aspects of the journey. These components are outlined in Figure 1 below.
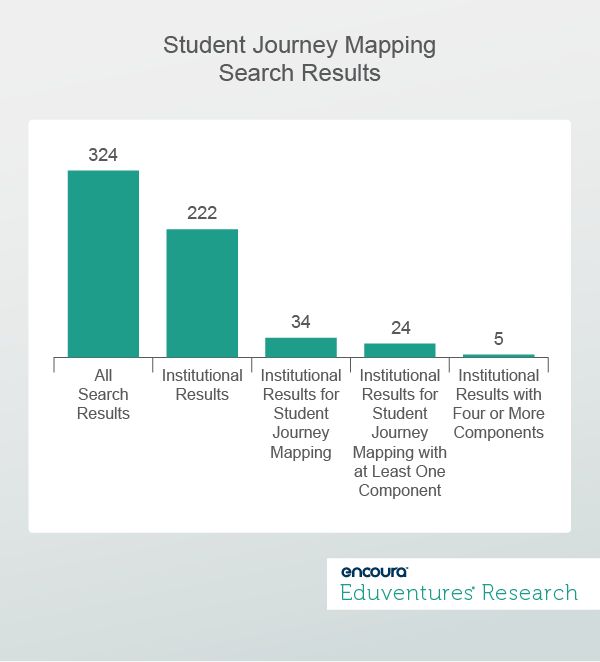
To understand the extent to which student journey mapping efforts are being used by institutions of higher education, we used Google searches and web scraping to find as many examples as we could. As shown in Figure 2 below, the output of this research revealed:
- 324 webpages had occurrences of at least one of our search terms, 222 of which were non-vendor and institutional sites.
- 34 webpages had either a student journey map or reflected a student journey approach.
- 24 webpages had at least one component.
- Five webpages had student journey maps had four components—the most of any in our sample: Arizona State University, Georgia Southern University, Laurentian University, New York University, and University of New Mexico.
Findings
On the surface, our research suggests that very few institutions have engaged in student journey mapping. Because this analysis relied on publicly available information, however, more schools may implement the practice of student journey mapping but decide to keep it confidential. Likewise, of the student journey maps we examined, there is little evidence that most of the institutions implemented the maps as part of an ongoing practice to better track progress of specific efforts for continuous improvement.
The most developed example of student journey mapping and implementation we found is Arizona State University (ASU). Its mapping approach, aligned with its lifelong learning efforts, includes a set of metrics, norms, and processes to better track, understand, and improve the student experience.
Under the leadership of the director of enrollment analysis (Office of the Provost), ASU spent six months gathering 65 data points and "student process artifacts," engaged more than 40 people across 12 departments, and convened more than 30 interviews and workshops. The primary focus of student journey mapping has been on the post-enrollment to graduation portion of the student life cycle, with less attention paid to pre-enrollment or alumni stages.
The Bottom Line
We suggest three considerations for any institution seeking to develop and implement student journey mapping to improve the student experience:
- Place students at the center of the effort: The goal of student journey mapping is to improve the quality of student interactions with the institution. Therefore, it is critical to ensure that any school embarking on a student journey mapping process first recognizes that not all students are the same and that they will experience similar interactions differently. Developing student personas (something ASU has also done), for example, is a valuable way to capture different student types and view how they progress along their journeys.
- Bring together institutional stakeholders: Some institutional maps appear to be narrow (focusing on admissions, for example), focused on one aspect of the student journey. Narrow journey mappings, however, may also signal a challenge in bringing together stakeholders from multiple departments, such as admissions, facilities, teaching and learning, and student support. Developing a journey map that encompasses the entire student journey will require thinking through all the unique touchpoints between a school and its students and the involvement of representatives from each touchpoint.
- Establish key performance indicators for measuring success: It is essential to develop metrics by which institutional leaders can determine whether the student journey map is successful in helping them deliver that quality experience. Without a review of metrics, there is a risk that the student journey map becomes a "point in time" artifact that does not help institutions understand the precise areas where they can improve the student experience.
It is striking that few institutions have embarked on mapping efforts—or that at least few have made sufficient progress to justify public disclosure. The typical institution has no shortage of concerns about student engagement, achievement, and attrition, not to mention disparities by student type and background. The pandemic may force schools to pay more attention to the student journey but may equally sideline ambitious initiatives. It will be interesting to see whether mapping efforts grow in number from today's small base and whether pioneers such as ASU start to reap the rewards in terms of recruitment, retention and reputation.
Never Miss Your Wake-Up Call
Learn more about our team of expert research analysts here.
Eduventures Principal Analyst at ACT | NRCCUA
Contact
Thursday, September 3, 2020 at 2PM ET/1PM CT
Hindsight is 2020. While the uncertainty of the past several months has provided us with unforeseen challenges, it also offered us guidance on how to better prepare for the future.
On Thursday, September 3rd, President Brent Ramdin will be joined by University of Tampa’s AVP of Enrollment, Brent Benner, as well as Encoura Enrollment Consultant, Tye Mortenson, as they discuss how University of Tampa was able to navigate the challenges of the last recruitment cycle. The conversation will focus on the impact of test optional on admissions, the increased competition for out-of-state students, and the urgency to pivot to virtual recruiting methods.
Join us to learn how the University of Tampa is rising to the challenges of 2021 leveraging Encoura Data Lab and rolling out new practices. Participants will gain insights into best practices needed to make the class in 2021.
