Driven by falling high school graduate numbers and a strengthening economy, higher education enrollment has shrunk five years in a row. By contrast, enrollment in online programs continues to grow, reaching three million students in Fall 2016.
But because online students can enroll in programs offered by schools anywhere in the country, online enrollment growth may benefit out-of-state schools more than local ones. This of course raises questions: Are some states giving up lots of students to online programs offered by out-of-state schools? Does it matter?
In a Wake-Up Call last May, we examined enrollment by state residents in fully online undergraduate programs at in-state schools. Here’s a snapshot:
In Fall 2015, state residents studying fully online as a proportion of all undergraduates at in-state, four-year schools ranged from 0.6% in Rhode Island to 18% in Maryland. The national average was 5.5%. Population density, educational attainment, state funding, and the presence of specialist online schools explained much, but not all, variation. We also speculated about state strategy, and lack thereof, to use online learning to efficiently grow higher education capacity.
Today’s Wake-Up Call addresses the parallel question of enrollment by state residents in fully online programs offered by out-of-state schools. Are some state much better markets for out-of-state schools? If so, why? It has not been possible to address these questions—until now.
According to new data from the National Council for State Authorization Reciprocity Agreements (NC-SARA), we estimate that one-third of states are net exporters of online students. NC-SARA was formed to align borderless online delivery with state-bound regulation. It designates a school’s home state as the regulator regardless of where a school’s enrolled online students reside. Today, all but two states (California and Massachusetts) are part of SARA, and SARA has published state-level enrollment data for about 1,500 participating schools, including most of the major players.
Figure 1 groups states into three categories:
- Majority of Residents in Fully Online Programs are Enrolled at In-State Schools
- Majority of Residents in Fully Online Programs are Enrolled at Out-of-State Schools
- Balance Between In-State and Out-of-State Schools (less than two percentage points difference)
SARA does not collect this data by level or field of study, so Figure 1 combines undergraduate and graduate students at two- and four-year schools. The SARA 2016/17 data has been modeled to represent the national market.
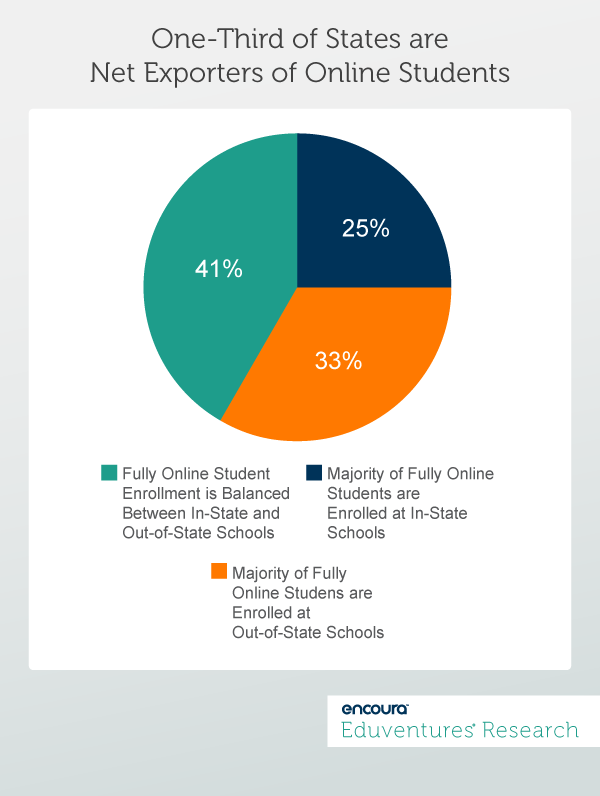
Many states that are net exporters of fully online students (the orange segment) tend to be geographically remote with low population density (Alaska, Hawaii, Montana, Nevada, Wyoming). For these states, in-state higher education is more limited or less accessible. Other net-export states are small and close to many other states (Connecticut, Delaware, DC, New Jersey, Rhode Island), where the higher education market is regional. In both cases, greater reliance on out-of-state online programs is not surprising.
The placement of Georgia and South Carolina in this category may reflect a strong military presence. Online degrees are popular among service members, many of whom may be redeployed while enrolled, blurring the definition of residence. Indeed, diverse definitions of state residence may complicate how different jurisdictions classify online students at the margins. Online institutions like Western Governors University, based in Utah but with a state-sanctioned presence in half-a-dozen other states, muddies the in-state/out-of-state distinction.
States where a majority of residents enrolled in online programs are registered at in-state schools (the blue segment in Figure 1) include states with a large local online provider, such as University of Maryland University College (UMUC), Arizona State University (ASU), and Southern New Hampshire University (SNHU). A well-established online learning network among public institutions is consistent with the likes of Florida, Kentucky, Minnesota, Nebraska, and Texas placing in this category.
Figure 2 below digs deeper. For the first time, we can not only see the number of state residents enrolled in online programs offered at out-of-state schools, but can also put this number in the context of enrollment by state residents—both online and campus—at in-state schools.
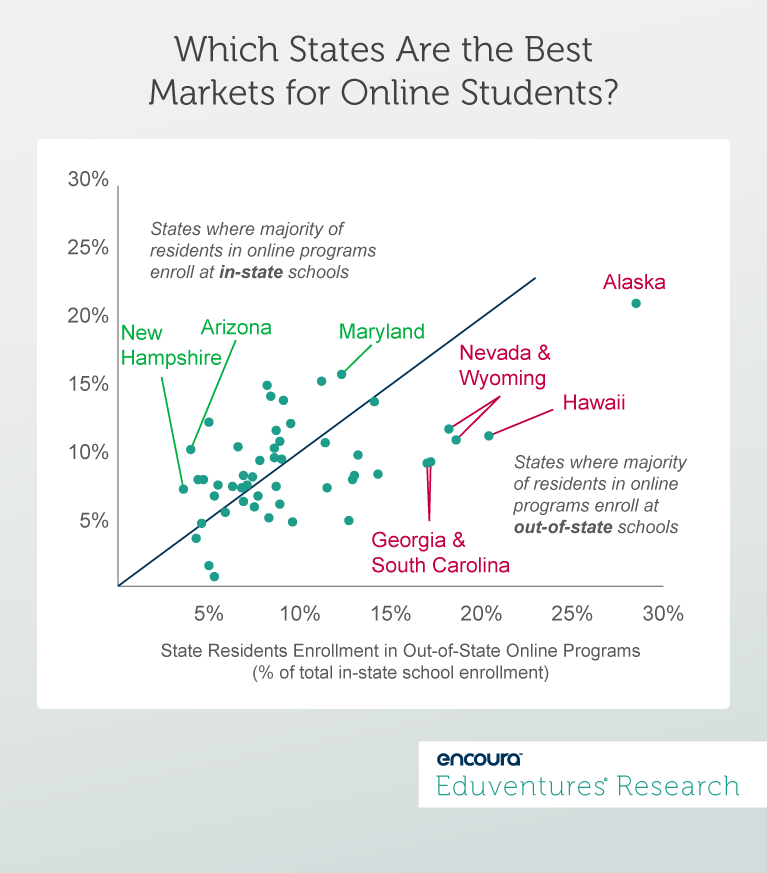
How to interpret Figure 2? If a state falls below the diagonal line in the middle of the chart (e.g. Georgia), more residents enroll in online programs in out-of-state schools than those at in-state schools. If a state falls above the line (e.g. Maryland), more residents enroll in in-state online programs.
The two ratios combine to show the total number of state residents enrolled in online programs as a proportion of total enrollment at any type of in-state school. For example, in Georgia, 9% of residents enrolled at in-state schools are enrolled online; another 17% of state residents are enrolled in online programs offered by out-of-state schools. So almost twice as many Georgia residents enroll online in out-of-state schools as enroll in-state.
On average, 9% of resident students enroll in in-state online programs. But the equivalent of another 10% of resident students (online and campus) is enrolled in online programs offered by out-of-state schools. This out-of-state online enrollment ranges as high as 29% in Alaska to as low as 4% in New Hampshire.
By this measure, higher population states such as Colorado, Georgia, North Carolina, and Washington—all of which “send” the equivalent of more than 10% of in-state school total enrollment to out-of-state online providers—are great markets for out-of-state online programs, despite the fact that these states all have prominent homegrown online institutions. By contrast, states like New Hampshire and Arizona, dominated by local online big shots, suggest less room for competition, at least so far.
How should state policymakers and institutional leaders judge these numbers? Is a high out-of-state online enrollment ratio among state residents a missed opportunity for local schools, or an efficient way to add capacity? Should every state invest in its own SNHU or ASU?
There are no simple answers to these questions, but Eduventures will explore the evidence in our forthcoming Online Higher Education Market Update report. In the meantime, if you are curious about the coordinates of your state in Figure 2, or if you want to size up the market opportunity in another state, please ask your Eduventures Client Research Analyst.
UPDATE: Since publication, we have received an overwhelming response for our full enrollment data set. You can find our analysis of the new NC-SARA data for all 50 states below.
Learn more about our team of expert research analysts here.
Do State Residents Studying Online Enroll In-State or Out-of-State?
| State Code | State Residents- Enrollment in Out-of-State Online Program (as % of total in-state school enrollment- resident and non-resident) | State Residents- Enrollment in In-State Online Programs (as % of total in-state school enrollment- resident and non-resident) | Combined | Category- Scale | Category- Balance |
|---|---|---|---|---|---|
| AK | 28.5% | 20.7% | 49.3% | Very High | Majority Out-of-State |
| AL | 9.0% | 9.3% | 18.3% | Medium | Balance |
| AR | 8.9% | 10.6% | 19.5% | Medium | Balance |
| AZ | 4.0% | 10.0% | 14.1% | Medium | Majority In-State |
| CA | 5.5% | 7.4% | 12.8% | Medium | Balance |
| CO | 13.0% | 8.1% | 21.1% | High | Majority Out-of-State |
| CT | 8.3% | 5.0% | 13.4% | Medium | Majority Out-of-State |
| DC | 5.3% | 0.7% | 6.0% | Low | Majority Out-of-State |
| DE | 8.9% | 6.0% | 14.9% | Medium | Majority Out-of-State |
| FL | 9.5% | 11.9% | 21.4% | High | Majority In-State |
| GA | 17.0% | 9.0% | 26.0% | High | Majority Out-of-State |
| HI | 20.4% | 11.0% | 31.4% | Very High | Majority Out-of-State |
| IA | 4.7% | 7.8% | 12.5% | Medium | Majority In-State |
| ID | 8.7% | 7.3% | 16.0% | Medium | Balance |
| IL | 7.5% | 5.8% | 13.2% | Medium | Balance |
| IN | 6.9% | 8.1% | 15.0% | Medium | Balance |
| KS | 6.6% | 10.2% | 16.7% | Medium | Majority In-State |
| KY | 8.4% | 13.9% | 22.3% | High | Majority In-State |
| LA | 11.5% | 7.2% | 18.7% | Medium | Majority Out-of-State |
| MA | 4.6% | 4.6% | 9.2% | Low | Balance |
| MD | 12.3% | 15.5% | 27.8% | High | Majority In-State |
| ME | 8.6% | 10.1% | 18.7% | Medium | Balance |
| MI | 6.3% | 7.3% | 13.6% | Medium | Balance |
| MN | 4.4% | 7.8% | 12.3% | Medium | Majority In-State |
| MO | 7.4% | 8.0% | 15.5% | Medium | Majority In-State |
| MS | 11.4% | 10.5% | 21.9% | High | Balance |
| MT | 12.7% | 4.8% | 17.4% | Medium | Majority Out-of-State |
| NC | 14.1% | 13.5% | 27.6% | High | Balance |
| ND | 11.2% | 15.0% | 26.2% | High | Majority In-State |
| NE | 5.0% | 12.0% | 17.0% | Medium | Majority In-State |
| NH | 3.6% | 7.1% | 10.6% | Medium | Majority In-State |
| NJ | 9.6% | 4.7% | 14.2% | Medium | Majority Out-of-State |
| NM | 9.1% | 13.6% | 22.7% | High | Majority In-State |
| NV | 18.6% | 10.7% | 29.4% | High | Majority Out-of-State |
| NY | 4.3% | 3.5% | 7.9% | Low | Balance |
| OH | 7.8% | 9.2% | 17.0% | Medium | Balance |
| OK | 8.6% | 9.4% | 17.9% | Medium | Balance |
| OR | 7.1% | 7.4% | 14.5% | Medium | Balance |
| PA | 7.7% | 6.6% | 14.3% | Medium | Balance |
| RI | 5.0% | 1.5% | 6.6% | Low | Majority Out-of-State |
| SC | 17.2% | 9.1% | 26.3% | High | Majority Out-of-State |
| SD | 8.2% | 14.7% | 22.9% | High | Majority In-State |
| TN | 12.9% | 7.8% | 20.7% | High | Majority Out-of-State |
| TX | 8.7% | 11.4% | 20.1% | High | Majority In-State |
| UT | 5.3% | 6.6% | 11.9% | Medium | Balance |
| VA | 13.2% | 9.6% | 22.7% | High | Majority Out-of-State |
| VT | 6.9% | 6.2% | 13.1% | Medium | Balance |
| WA | 14.3% | 8.2% | 22.5% | High | Majority Out-of-State |
| WI | 6.8% | 7.2% | 14.0% | Medium | Balance |
| WV | 5.9% | 5.4% | 11.3% | Medium | Balance |
| WY | 18.2% | 11.5% | 29.8% | High | Majority Out-of-State |
| Balance= within two percentage points. |
Source: Eduventures analysis of IPEDS and SARA data.