Question: What should happen when the most-widely recognized college ranking publication decides to insert a social mobility metric into its longstanding methodology?
Answer: Higher education should sit up and take notice.
Monday’s announcement that U.S. News and World Report has modified its ranking methodology to acknowledge the value of social mobility and downplay the value of selectivity is a significant – albeit largely symbolic – development. Beyond the significance of rankings, however, it had us asking: does it signal a larger shift in how quality in higher education can or should be measured?
In particular, it follows an unusual effort by the Department of Education (ED) to redesign accreditation and quality measurements that merits watching. Last month, Secretary of Education, Betsy Devos, called for a new negotiated rulemaking process to “rethink” accreditation policies by focusing on how educational quality is measured. This “rethinking” process follows reversals of Obama-era higher education regulations on gainful employment and borrower defense.
ED’s rulemaking seeks to revise and simplify guidelines for how accreditors would work with their member institutions. The review would include efforts to standardize the definitions and criteria accreditors use to measure “educational quality.” These include many broadly used - and certain to be wildly-contested - terms such as “distance education and correspondence courses,” “regular and substantive interaction,” “credit hour,” and “direct assessment and competency-based education (CBE).”
Whether ED is ready to take on these challenges or not, this agenda has the potential to generate considerable interest and participation. Its primary challenge is not only to build consensus around a “rethinking” of accreditation, but to envision and use a unified data system for accreditors to effectively measure “quality” and encourage innovation. The question is, what could that system look like?
The Missing Link
ED has made several references, absent specific funding, to expanding the use of program-level data through the Obama-era College Scorecard. Is it possible that an updated and funded College Scorecard could fill the data void?
A viable alternative may already exist. Unlike the U.S. News rankings, The Equality of Opportunity Project (EOP) posits an unambiguous assertion: the value of a school can be measured by its ability to create greater upward economic mobility for all students. EOP’s simple, but provocative, argument is that a higher education credential should increase the ability of students to improve their incomes beyond that of their parents and their parents' parents. EOP refers to this function of college as “intergenerational mobility.”
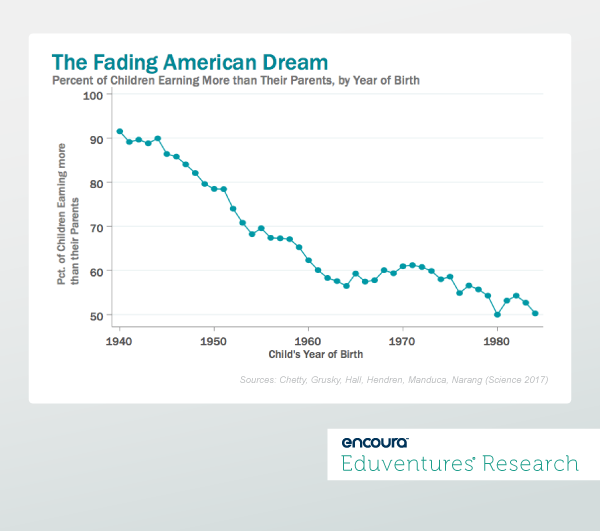
In his remarks at the 2018 Eduventures’ Summit, EOP project director, John Friedman, associated educational value with intergenerational mobility. The EOP’s baseline is the stark reminder that despite increased college attendance, such mobility is in precipitous decline (Figure 1).
Using this baseline, EOP has created a “mobility rate” for every U.S. college or university. This rate combines IPEDS attendance data, parents’ household income, and publicly available earnings data for graduates. It shows the percentage of students who come from families in the lowest economic quintile and end up in the highest following graduation – i.e., the "mobility rate."
These mobility rates reveal which schools have been able to accelerate the movement of poor students into the middle class, and which have failed to do so. If higher education is to take seriously the notion of achieving “the American dream,” or improving intergenerational mobility, the definition of what constitutes a “successful” college begins to shift.
Using the mobility rate measure, Friedman and his colleagues at the EOP have defined the top 10 colleges in the United States (see Figure 2).
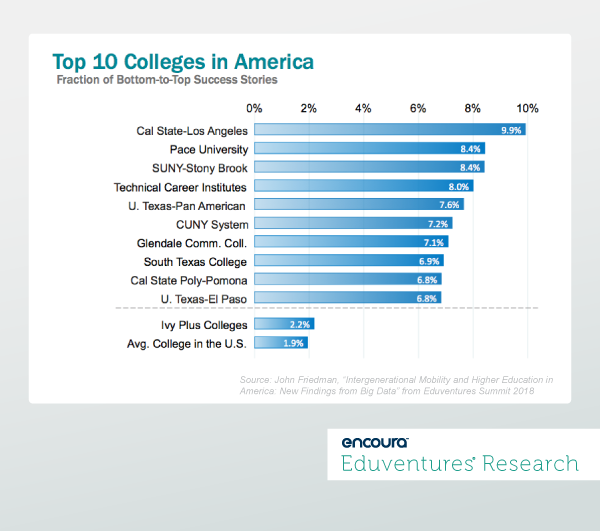
Notably, while some of these schools serve traditionally under-resourced and urban populations, others such as SUNY-Stony Brook and Pace University attract a broad range of traditional students. All, however, easily exceed EOP’s national mobility rate average of 1.9%. It’s possible for any school to explore its EOP mobility rate, compared to national averages and smaller cohorts. The EOP dataset can be accessed through a portal developed with the New York Times.
A New Era of Accountability
EOP is not using the “mobility rate” metric as merely an abstract measurement. Instead, the EOP has leveraged its data to create Collegiate Leaders in Increasing Mobility (CLIMB) project, a partnership with 237 public and private institutions, and several state systems. While CLIMB is still nascent, EOP hopes to shed light on best practices for supporting under-resourced students.
Certainly, ED’s own rulemaking efforts would do well to recognize the potential of such initiatives.
There’s no time like the present to chart a new course for accountability and quality. To stay on track, every higher education leader’s to-do list for the 2018-2019 academic year should include the following:
- Participate in ED’s upcoming negotiated rulemaking process. This can be done through the public comment period or the scheduled community meetings. The timing of this new negotiated rulemaking, amid ED’s decisions on gainful employment and borrower defense, underscores the importance of this new opportunity.
- Examine how your school performs on the “mobility rate” index. This can establish a baseline of how your school ranks relative to others. Is your school accelerating upward mobility and if so, how? Are these findings consistent with your institutional mission and brand, or are there surprises?
- Assess your current enrollment strategies. Are they more about finding a closer “fit” between students and programs or just building a larger funnel? Does your enrollment strategy include ways to not only attract high need student populations, but also build experiences and supports that closely align with their needs and goals?
- Innovate and share. Encourage homegrown innovations on your campus that explore the thorny issue of quality measurement. Share these innovations with us and your peer institutions.
Negotiated Rulemaking and How to Participate
The negotiated rulemaking process is stewarded by Deputy Undersecretary Diane Auer Jones, a former appointee of President George W. Bush, and a for-profit and an experienced for-profit college executive. Negotiated rulemaking is an established technique in which a federal agency seeks public input from interested stakeholders in an effort to build consensus around proposed rules. The process includes ample opportunities for public input, submitted electronically, or presented at three public sessions in September. For more information on how to participate, click here.
Join us on Thursday, September 20, 2018 at 1pm Central/2pm Eastern for our next webinar!
Generation Z is here and enrolling! How have you or will you change your recruitment and enrollment strategies? This presentation, based on Eduventures Prospective Student Survey, outlines the key distinctions between Millennial and Gen Z students and the implications these distinctions have on college enrollment decisions.
Join Eduventures Principal Analyst Kim Reid as she shares key themes for pivoting to serve Gen Z students better in recruitment and enrollment, as well as options for participating in the 2018 Prospective Student Survey.
<img src="https://encoura.org/wp-content/uploads/2019/01/encoura_EV-lockup_stacked_reverse-ret.png" style="width:80%; margin:25px 25px 0;"><h2 style="color: #fff; padding: 27.84px 25px 0; margin: 0; font-size: 26px;">Never<br /> Miss Your<br /> Wake-Up Call</h2><!-- --><script src="//app-ab23.marketo.com/js/forms2/js/forms2.min.js"></script><!-- --><form id="mktoForm_1212"></form><!-- --><script>MktoForms2.loadForm("//app-ab23.marketo.com", "514-WFI-660", 1212);</script><script src="//app-ab23.marketo.com/js/forms2/js/forms2.min.js"></script><!-- --><script><!-- -->MktoForms2.whenReady(function (form){<!-- --> //Add an onSuccess handler<!-- --> form.onSuccess(function(values, followUpUrl){<!-- --> //get the form's jQuery element and hide it<!-- --> form.getFormElem().hide();<!-- --> document.getElementById('confirmform').style.visibility = 'visible';<!-- --> //return false to prevent the submission handler from taking the lead to the follow up url.<!-- --> return false;<!-- --> });<!-- -->});<!-- --></script><!-- --><div id="confirmform" style="visibility:hidden; padding: 20px 20px 20px 20px; color: #fff; background-color:#1e9d8b;"><p>Thank you for subscribing!</p></div>