
Almost three years ago, Eduventures first highlighted a little-reported trend: The proportion of bachelor’s degree holders enrolled in graduate education had fallen steadily since 2013. That finding served as a startling discovery given the decade of sustained graduate enrollment growth over the same period. Now, after a few terms of fluctuating graduate enrollment, that finding seems prescient.
Three years on, how has this trend developed, and, what else have we learned about graduate enrollment?
Asked and Answered
Three years ago, Eduventures noted that the proportion of Americans aged 25-44 with a bachelor’s degree enrolled in higher education dropped between 2013 and 2021. Notably, however, the 2021 enrollment rate was up slightly from an all-time low of 6.44% reported in 2020 and shown in Figure 1 below.
The question posed at that time: Would the graduate enrollment rate continue to rebound or start shrinking again as we left the pandemic behind? Now we have our answer.
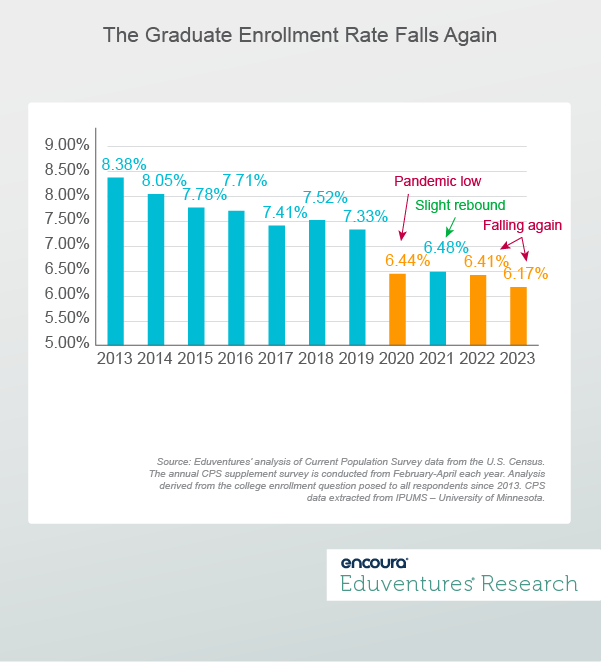
Figure 1.
After a slight 2021 rebound (to 6.48%), the graduate enrollment rate stumbled again in 2022, reaching a new low in 2023: 6.17%.
Reasons for the decline are numerous. Graduate enrollment rises and falls in lockstep with the U.S. economy. Having just exited a 27-month period of sub-4% unemployment, the story of the past two years-plus has been one of robust post-pandemic economic recovery. Yet, at the same time, it has also been one of stubborn inflation and increasing concerns over the cost of higher education. Eduventures’ 2023 Adult Prospect Research™, for example, found that 55% of master’s degree prospects reported being “very worried” or “worried” about paying for a program, while 56% of graduate prospects cited affordable tuition/fees as a top decision factor.
The big concern here is the coming graduate-aged demographic slowdown. Between 2010 and 2022, the key graduate student cohort of Americans aged 25-44 grew by 9%—faster than the overall population and the force behind the growth in absolute enrollment despite a falling enrollment rate. Looking ahead to 2034, this demographic is projected to grow by only 5%—slower than the overall population. Slowing population growth and declining participation rates translate to challenging market dynamics.
Understand Your Prospects
Schools will need to dig deeper in the years ahead to truly better understand who graduate prospects are. For example, what can we learn about who does, and equally, who does not, participate in graduate education? This will help inform how schools position themselves in the market.
Eduventures has previously reported that younger bachelor’s holders enroll at higher rates than older bachelor’s holders and women at higher rates than men. But what can we learn about one’s occupational profile and aligned enrollment activity?
Figure 2 provides a sample of occupations falling above and below the average graduate enrollment intensity. For context, over the last five-year period, the overall average graduate enrollment rate for all bachelor’s educated Americans aged 25-44 was 6.6%.
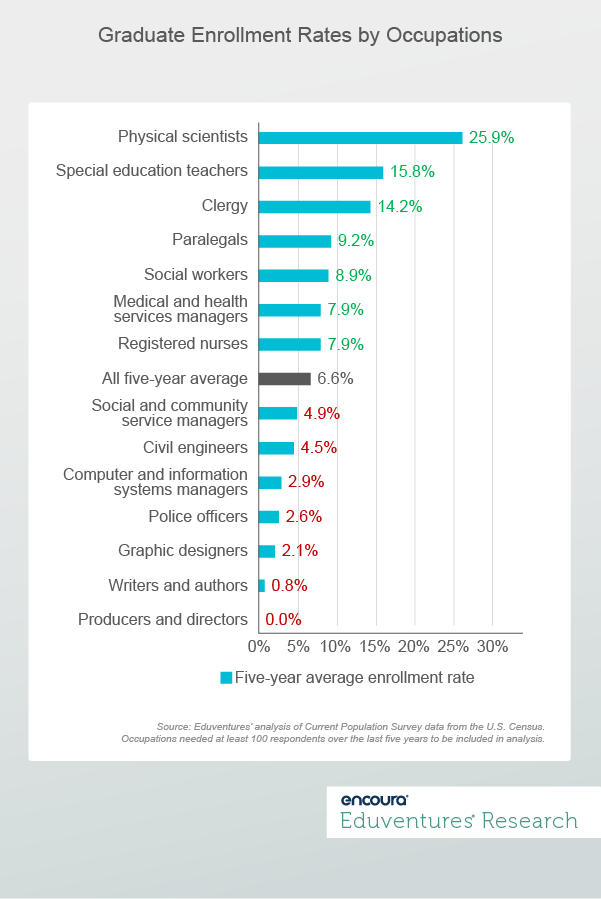
Figure 2.
In many cases, we can explain above-average enrollment activity. Nurses need master’s degrees to become nurse practitioners or assume leadership positions. Social workers need master’s degrees to enter supervisory, clinical, or specialty practices. Paralegals need law degrees if they want to begin practicing law. Teachers, while no longer required to attain master’s degrees for licensure in most states, often will receive a pay raise after attaining an advanced degree.
The same cannot as easily be said for those occupations with below-average graduate enrollment rates, like police officers and graphic designers. One limitation of this data, however, is that we do not know what people studied when they enrolled. But if we assume respondents continued their studies in their current career tracks and viewed graduate enrollment in markets with clear alignment to these occupations, we can see clear underperformance.
Figure 3 further highlights this trend for five occupations with below-average graduate enrollment rates (of less than 3%).
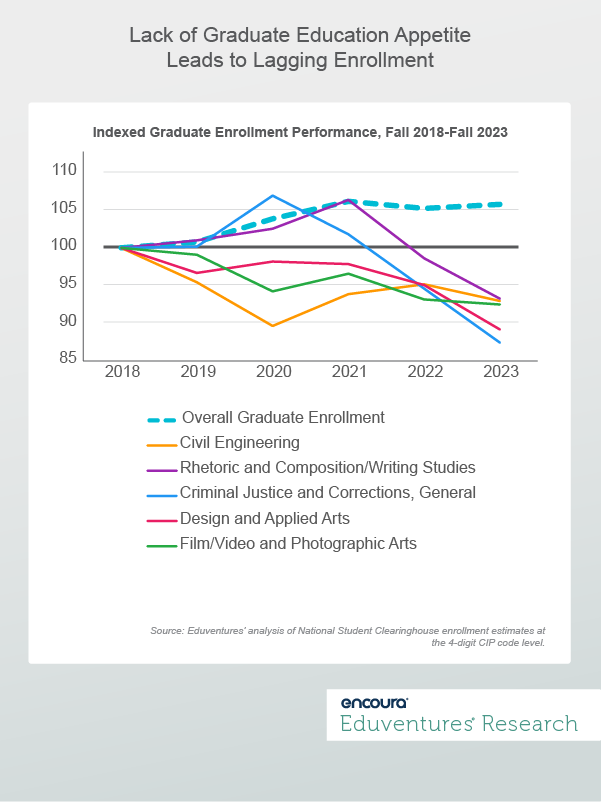
Figure 3.
Figure 3 shows that while the overall graduate market has fluctuated in more recent years, fall 2023 enrollment was still 6% above that of fall 2018. Over this same period, the five occupations featured in Figure 3 all shrank by 7-13%.
Notably, some of the most striking declines come after 2021—amid immense value-questioning in the graduate market. At that time, all five of these fields reported a total of 16,000 students or less with two under 5,000. In other words, they are small fields, underperforming in the market, where bachelor’s-educated professionals in aligned jobs are enrolling at below-average rates.
The Bottom Line
The road ahead for the graduate market may be bumpy. While the economy is hard to predict, some of the underlying demographic and demand trends are hard to ignore. Our guidance? Leave no stone unturned when it comes to understanding the many forces at play.
This means that educational activity in program-aligned workforces is a critical input to this process, rather than relying solely on degree attainment activity as in years past. Published last week, Eduventures’ 2024 Master’s Market Update outlines two points of focus in coming years:
- Gain a deep understanding of master’s degree prospects
- Emphasize master’s programs where enrollment sustainability and growth are most likely

