How many students are enrolled in U.S. higher education? It depends on how you count.
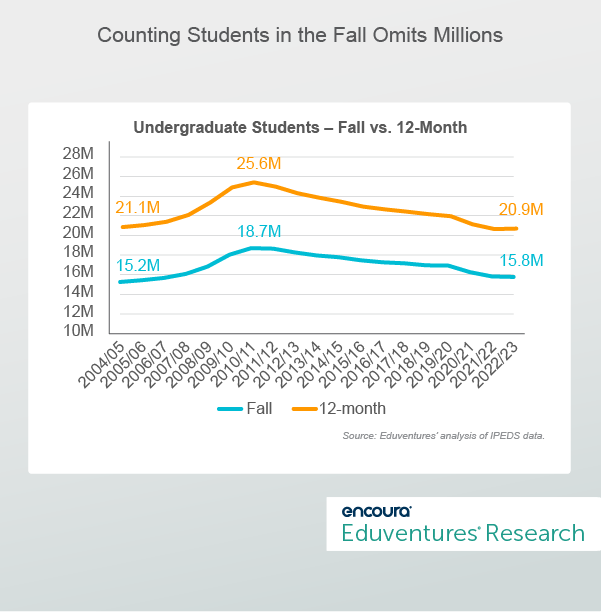
The conventional method is counting students at a single point-in-time, in the fall. By that measure, according to IPEDS, there were 15.8 million undergraduates and 3.2 million graduate students in fall 2022.
An alternative metric, also in IPEDS, produces much higher totals. What is this metric and who are these “missing” students? What does this alternative perspective reveal about student demand?
Count me in!
The alternative enrollment metric (also in IPEDS) is a 12-month unduplicated headcount, i.e., the number of unique students enrolled over a year. This captures students who enroll outside the fall window (e.g., January start date), course-only students or those enrolled in non-degree programs, and those who enroll and drop out before the next fall count. Both counting metrics, fall and 12-month, document only students in credit-bearing courses and programs.
The difference between fall and 12-month enrollment is significant. Figure 1 plots the two trend lines for undergraduate students over the past 20 years.
Figure 1.
On average, the 12-month metric counted six million additional unique undergraduates per year compared to the fall enrollment totals. That is an average of 35% more students each year!
Think about that for a minute: most discussion of undergraduate enrollment ignores millions of students.
The picture is similar for graduate students. As of fall 2022, there were 3.2 million graduate students, but four million over the span of 2022/23—a 26% increase.
Who are these missing students?
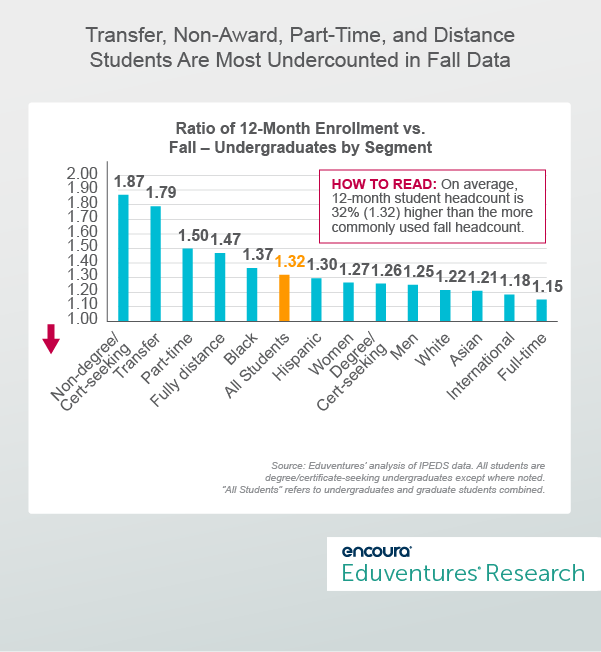
Let us focus on undergraduates. Figure 2 shows the ratio between the two metrics: 12-month counts to fall counts. It shows that the ratio varies by segment. For example, the 12-month count of transfer students is 87% higher than the fall count (a 1.87 ratio) and international students are 18% higher (a 1.18 ratio).
Figure 2.
Figure 2 reveals a clear pattern. The students most visible in the 12-month enrollment data are non-traditional, underrepresented, or transfer students. This makes sense since many of these students take advantage of non-standard pathways, enrolling part-time or online. These options are associated with multiple start dates and atypical schedules that elude the conventional fall census.
This includes "non-degree/certificate-seeking" students such as dual enrollment students—high school students enrolled in college courses. Dual enrollment students may enroll and complete their courses within a single semester and might not be included in the standard count if they enroll in the spring or summer.
Figure 2 also shows that routine enrollment tracking also seriously undercounts other key populations, including:
- Black Students - based on fall 2022 data, Black students accounted for 12.8% of undergraduates, but 13.9% using 12-month figures. That is a missing 645,000 students!
- Online Students - fully online undergraduates made up 23% of all undergraduates as of fall 2022 but 27% using the 12-month data. That means 1.5 million additional students!
- White, Asian, International, and Full-time Students - much less prominent in the 12-month data, highlighting greater alignment with the fall enrollment norm.
Nontraditional Undergraduate Enrollment in Retreat … But Is a Revival on the Horizon?
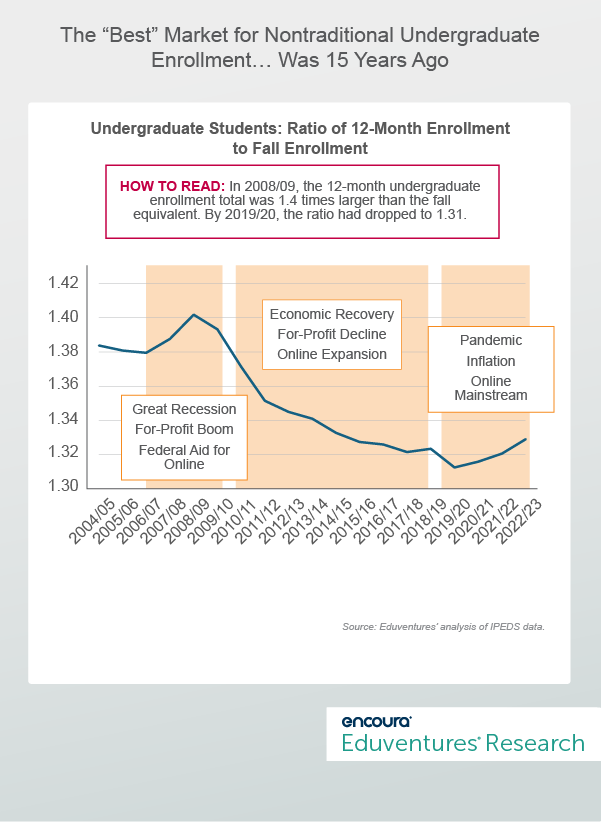
Figure 1 shows both fall and 12-month undergraduate enrollment peaking in 2009/10 and then falling steadily. The two lines appear to be rising and falling in tandem, but Figure 3 (below) reveals a more interesting finding. Figure 3 shows undergraduate 12-month enrollment as a ratio of fall enrollment, revealing the relative importance of non-traditional students over time.
Figure 3.
It turns out that 2009/10 was not only the year of peak undergraduate enrollment (both fall and 12-month), but also when the ratio between the two was at its highest: 1.4 (i.e., there were 40% more undergraduates in the 12-month total than fall). The combination of the Great Recession, a boom in for-profit institutions, and the striking of the ban on federal student aid for fully distance programs pushed up non-traditional enrollment outside the fall window.
But as the economy recovered and for-profits retreated, the 12-month enrollment ratio entered a long decline. The confusion of COVID depressed the ratio further but the most recent three years witnessed a modest revival.
Why?
Post-pandemic economic churn and uncertainty played a role, as did wider availability of online programs. The end of COVID stimulus, the jump in living costs, and an uptick in unemployment boosted non-traditional demand. Continued interest in dual enrollment to defray college costs is also a factor, plus (credit-bearing) non-degree and microcredential momentum.
More recent evidence, including the Eduventures Enrollment Rate Tracker (using the Census Bureau’s Current Population Survey), points to a modest improvement in adult undergraduate demand, through mid-2024.
It is ironic that growing institutional interest in adult learners and online programs over the past decade coincided (until recently) with a drop in 12-month undergraduate enrollment and a decline in the 12-month versus fall enrollment ratio.
But the apparent contradiction makes sense. Institutional interest was spurred by the challenge of recruiting adult undergraduates in a strong economy. Adult-friendly offerings no doubt slowed adult enrollment decline but anti-enrollment macro-economic forces were unstoppable.
Going forward, greater economic friction is (more irony) good news for the adult undergraduate market.
The Bottom Line
Neither fall nor 12-month is the “correct” enrollment metric, but the latter offers a more comprehensive view. The 12-month count better captures the non-traditional students many institutions are striving to serve and the non-standard modalities schools have invested in.
Comparison between fall and 12-month counts is a valuable gauge of traditional versus non-traditional demand. Using 12-month data enables schools to profile the millions missing from fall numbers. As the “demographic cliff” nears, anticipating a shortfall in traditional undergraduate demand, schools must look to non-traditional cohorts to fill the gap.

Learn what online higher education leaders from across the U.S. had to say in this year’s CHLOE 9 (Changing Landscape of Online Education) Survey.


