
How do your admitted students view your institution’s net college cost? How does this compare to other institutions like yours? And, why do you need to know?
Not knowing leaves you in the wilderness, guessing about how undergraduate students think about price and value. Examining your net college cost profile against benchmark data provides insight into the complex interplay of price sensitivity, competitive pricing, availability of financial aid, and value perceptions in enrollment decisions.
Eduventures® national research from our Survey of Admitted Students™—with more than 90,000 student respondents—reveals this important benchmark data against which institutions can measure themselves. It shows the percentage of students who choose your institution as a lower, same, or higher net cost institution in comparison to the next alternate choice (if they had one); see Figure 1.
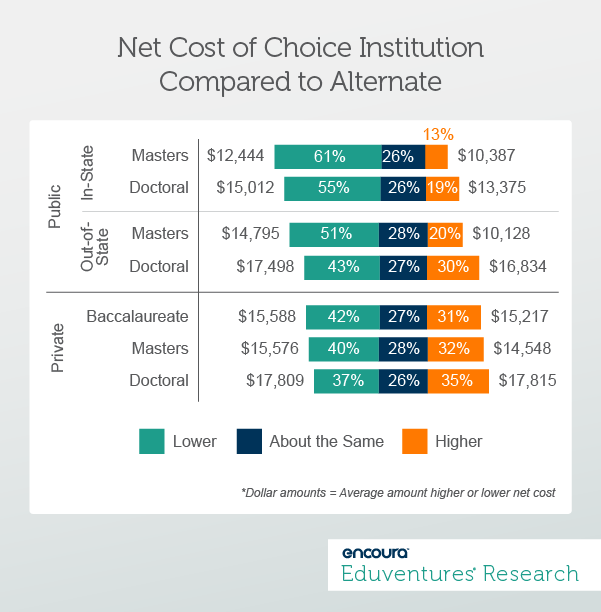
About a quarter of students across the board are making what they consider to be an apples-to-apples final decision. This means that their two final institutions are roughly equivalent in total net cost after scholarships and grants are taken into consideration.
For the rest of students who make a considered choice, some go low, and some go high. As expected, to a greater degree than those choosing publics. But, even in the more price-sensitive institutional categories, there are significant variations between individual institutions. That’s why it’s important to look at the benchmark, to see where your institution stands in the landscape.
In Figure 2, the example of out-of-state students at four public doctoral institutions against the benchmark shows this.
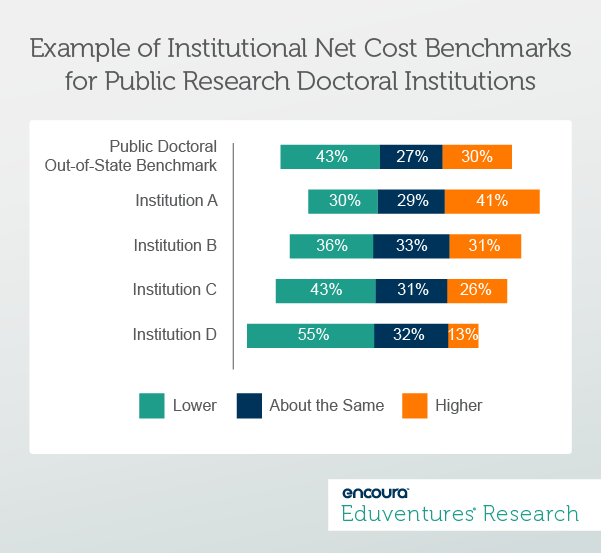
In this example, Institution C sits near the national benchmark, Institution D is drawing students who see it as a lower cost option, and the other two are drawing out-of-state students with a higher willingness to pay. What does this mean? Perhaps Institution A doesn’t put much aid on the table for out-of-state students and only those students with the ability to pay are able to choose to enroll. Perhaps Institution D is a lower tuition cost institution that serves a debt-averse student market.
It’s hard to say more without digging into the details. There are likely complex factors in play at each of these institutions having to do with the four factors below:
1. The student market you serve: Which student segments are most price sensitive?
There is neither a “good” nor a “bad” net cost profile to have, merely one that is accurate to your institution. Yours highlights the kinds of students who are choosing to attend your institution. It represents the overall price sensitivity of students in your corner of the market. Campus communities are comprised of many segments of students that have varying degrees of ability to pay, willingness to pay, and debt aversion. Some, but not all, of the underlying explanation for your net cost profile is in the details of your student demography.
2. Pricing pressure: What are you and your competitors doing for students on price?
Different geographic areas have greater competition for students in terms of the physical density of institutions in the area, the size of the addressable student market, and the head-to-head program competition in key academic areas. In highly competitive markets, tuition price wars may be underway. One example of this is public institutions waging interstate tuition waiver wars for out-of-state students. The increased local competition can impact students’ decisions to choose a lower cost competitor from a top-line tuition perspective.
3. Financial aid strategy: How much institutional aid are you making available for students?
Nearly three-quarters of all admitted students were offered some form of grant or scholarship by the institutions that admitted them. Of those students, 73% said that the award was influential in their admissions decisions. An institution’s aid strategy is reflected in its net cost profile. The generosity or scarcity of institutional grant aid enables students to choose your institution as either a low net cost institution or as a same or higher net cost institution. Therefore, the profile can be an indicator of whether or not your financial aid program meets the market standard.
4. The value you offer: Are students willing to pay more for your experience?
Finally, there is always a segment of students who will pay a premium for perceived quality. At some institutions this segment is quite large, at others it’s considerably smaller. Even if your institution only has a sliver of these students, increasing these numbers can help the operating budget significantly. The bonus is that improving quality to attract students improves quality for all students, making the experience for those who are highly price sensitive even better.
The Bottom Line
In the end, you may feel that your net cost profile is right for your institution. Or, you may seek to change that profile. You may use that profile as an impetus to understand how to offer more affordable tuition to an underserved student population. You may use the profile to consider the generosity of your institutional grant aid. You may use it to think about how to communicate individual-level value propositions to students during recruiting.
In any case, the benchmark should help you reflect on how you measure up on price and value. Of course, comparing your net cost data to benchmark data won’t necessarily tell you the right answer. But it will stimulate the right questions to ask.
Read about the net college cost benchmark and eight other key admitted student benchmarks in our upcoming report, Nine National Benchmarks for Admitted Students (and Why They Matter).
Thursday August 29, 2019 at 2PM ET/1PM CT
Much has been said about the characteristics and preferences of Gen Z, but new Eduventures research unveils that vast differences exist even within this generation. From distinct search strategies to micro-generational behaviors and attitudes, recruitment outreach needs to be more personalized than ever. Learn which outreach strategies help your marketing team engage the right students at the right time, and understand what many students wish colleges and universities got right.
Thank you for subscribing!
Thank you for subscribing!
