Like an action hero vanquishing a foe only to turn a corner to face another, higher education battled through the pandemic only to encounter the inflation monster.
Spurred by pandemic supply chain crunches, federal stimulus, and the war in Ukraine, the Consumer Price Index is now 9.1%, the fastest annual increase since 1981. As interest rates rise, many forecast a recession.
Might college enrollment—already battered by the pandemic—grow in the teeth of an economic downturn (like the Great Recession)? Or will soaring prices lead to soaring tuition and push enrollment down further?
Few working in higher education today remember the inflation gyrations of the 1970s and 1980s. Do the 70s and 80s
The View from the 2020s
Let us start with today’s data. Eduventures uses the federal Current Population Survey (CPS)—a longstanding monthly labor force survey spanning some 160,000 individuals a year—to track month-by-month enrollment trends.
CPS offers more timely enrollment information than IPEDS or the National Student Clearinghouse, but there is a trade-off between timeliness and validity. Sample segmentation and the self-reported nature of the data means a certain amount of volatility—sometimes making for outsized month-by-month enrollment rate swings—but the data is directionally sound. CPS has tracked Clearinghouse trends closely, reinforcing its value.
Figure 1 shows the enrollment rate for three student types from January 2020 to June 2022 compared to the equivalent month in 2019 as a pre-pandemic and pre-high inflation benchmark.
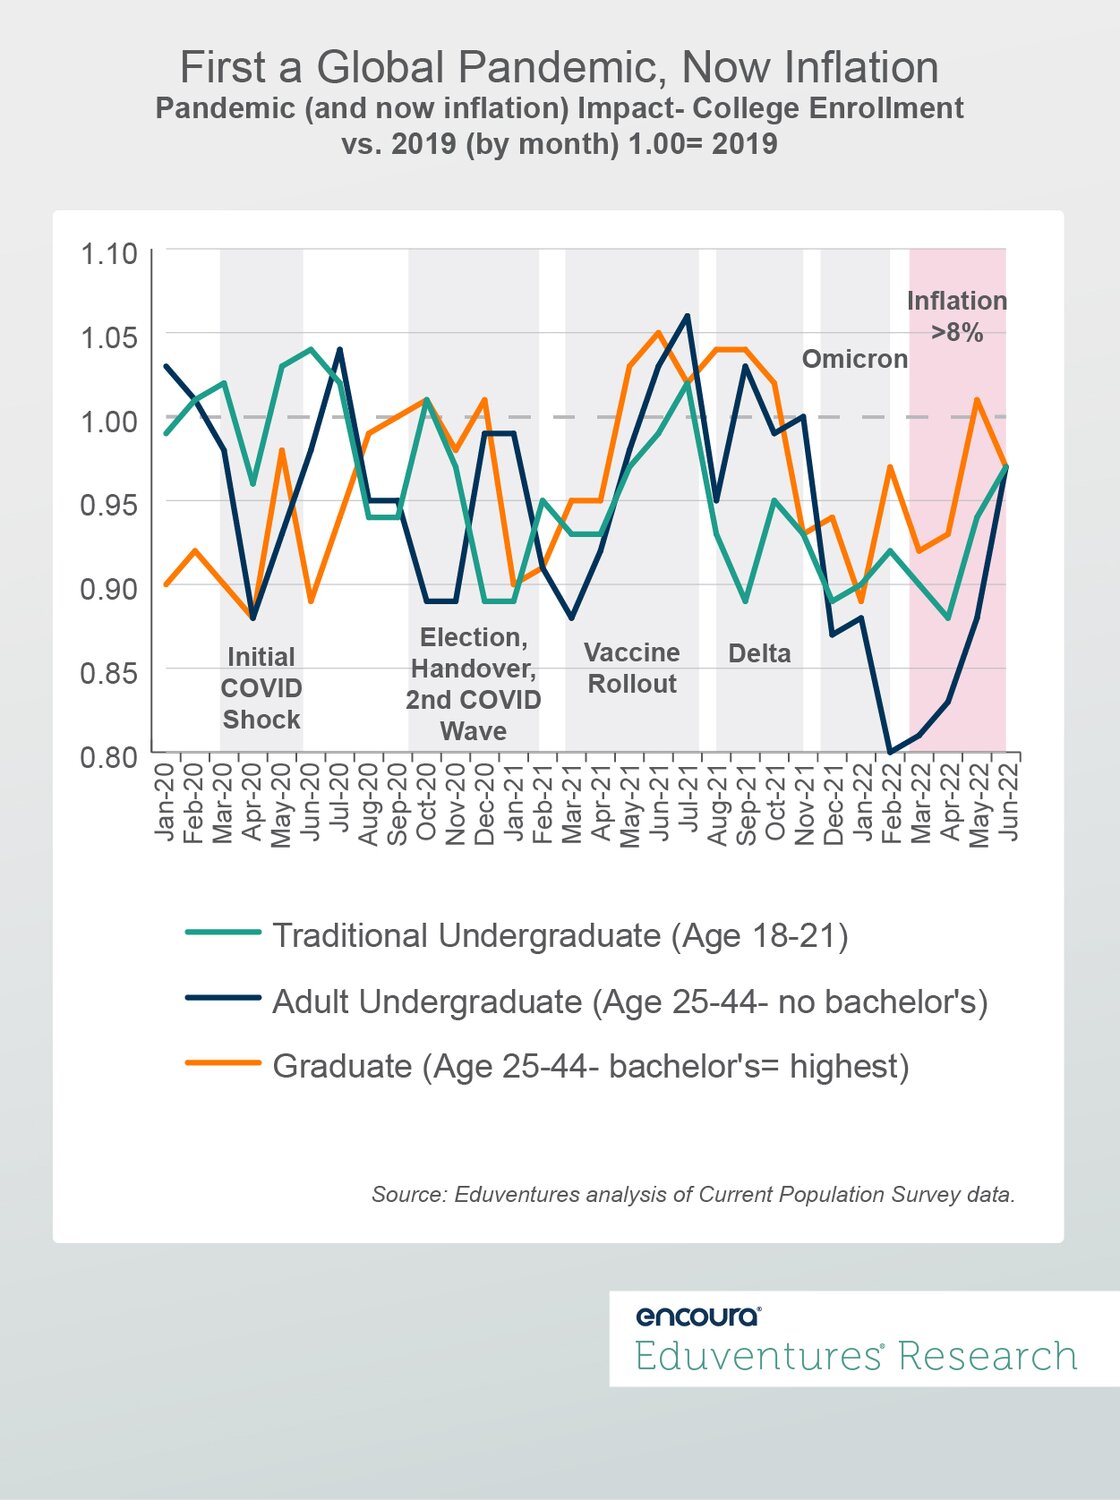
An obvious takeaway from Figure 1 is that since the start of 2020 student demand has typically been below the pre-pandemic baseline (2019). Pandemic disruption and uncertainty were net-negative for college enrollment. Only brief periods when the pandemic looked beat and the economy revived (early summer 2020 or mid-2021) did enrollment pull above the dotted line.
What about now?
The combination of a tight labor market and the Omicron variant sent traditional, adult undergraduate, and graduate demand down sharply in late 2021 and early 2022. According to the CPS data, adult undergraduate enrollment fell 20% below 2019 levels. In May and June, sentiment improved dramatically if still below the pre-pandemic benchmark.
The question is whether these gains are due to post-pandemic optimism alone or also growing consumer anxiety about the looming economic consequences of high inflation.
Based on the current state of the labor market it is hard to explain revived enrollment in terms of immediate economic stress. Jobs are plentiful and wages are rising. Unemployment has held steady at 3.6% for four months, a near-record low, but this may signal the bottom of the cycle. Enrollment gains may be registering the faint economic rumblings—hiring freezes, workforce trimming, stock market losses—of recent months. This suggests a more conventional enrollment response to economic trouble, but it is still in the early days. Eduventures will continue to track the CPS data.
But what can the 70s and 80s teach us about how college enrollment trends during—and following—periods of high inflation?
The View from the 1980s
Consideration of the last high inflation cycle from end-to-end may help us see ahead as we stand on the brink today. Back in the 70s and 80s, did peak inflation—or peak unemployment—coincide with peak enrollment?
Figure 2 charts enrollment, population, and unemployment over that time, breaking out traditional-aged undergraduate enrollment, adult undergraduates (using “part-time undergraduate enrollment” as a proxy), and graduate student enrollment.
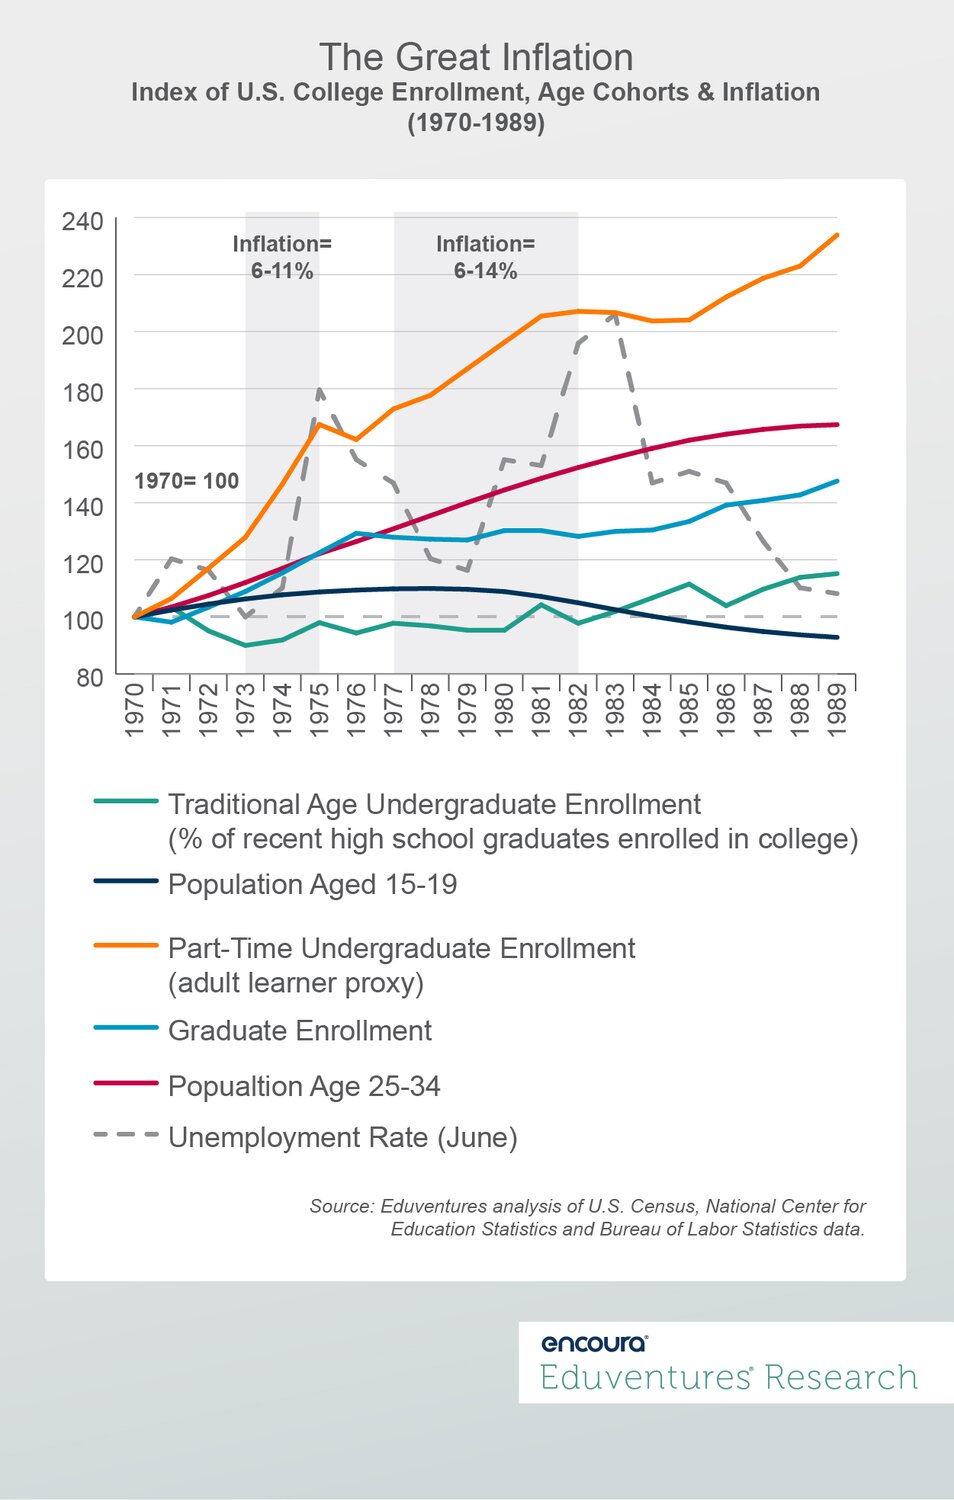
It is striking that both the immediate college-going rate among recent high school graduates and graduate enrollment were flat for the most inflationary periods in Figure 2. The immediate college-going rate was below the 1970 baseline for much of the 70s. Graduate enrollment was up in the first half of the 1970s, following the undergraduate boom of the 1960s, but was then flat from 1976 to 1984, the worst inflationary stretch.
The unemployment rate shot up as interest rate hikes were deployed to curb inflation. Both traditional-aged undergraduate and graduate enrollment picked up during the unemployment spike of the mid-70s but proved unresponsive during the early 80s unemployment surge.
The mid-70s recession was the first serious contraction in over a decade, prompting a stronger counter-cyclical enrollment response as a result. In 1972, an enrollment incentive was added, expanding the now Pell Grants. The prolonged period of volatility through the mid-1980s, with substantial price rises baked in and federal aid normalized, may instead have depressed enrollment.
College list tuition, net of inflation, was flat through the 1970s; evidence that rising prices forced schools to raise tuition but also that economic volatility depressed demand to the point that above-inflation tuition hikes were not sustainable. State funding for higher education per FTE during these years struggled to keep up with high inflation.
The fact that the traditional-aged undergraduate and graduate enrollment lines in Figure 2 both lag momentum in the underlying age group underscores weak higher education demand.
The outlier is part-time undergraduate enrollment, the best proxy available for adult undergraduates. Part-time enrollment boomed during the mid-70s period of high inflation, dipped slightly as inflation briefly fell, but then resumed growth through the early 80s. A smaller high school cohort convinced many schools to target adult learners during these years, experimenting with part-time study, distance learning and competency models. Such innovations had added appeal for students in times of economic stress.
The part-time undergraduate trend is consistent with the classic high unemployment/high enrollment correlation, and highlights adults without a degree as particularly sensitive to economic conditions.
Of course, there are other variables at play in Figure 2. Female higher education enrollment continued to mainstream in the 1970s, a trend independent of economic circumstances. The Vietnam War ended in 1975 and the draft two years earlier, contributing to the steep rise in part-time undergraduate enrollment. For-profit schools were admitted to federal student aid in 1972. A computer-based learning surge at for-profit schools explains some of the continued growth in part-time undergraduate enrollment in the late 80s.
The Bottom Line
Higher education’s encounter with inflation in the 1970s and 1980s is instructive as we face another over-heating economy. Traditional-aged undergraduate and graduate enrollment were often subdued during periods of acute inflation and unemployment, and consistently lagged their respective population cohorts, indicative of demand deflated by rapidly rising prices. By contrast, part-time undergraduate enrollment—affording precious flexibility during challenging times—spiked when unemployment soared.
In mid-2022, the enrollment trends of recent months suggest both renewed interest as the economy wobbles, but also enthusiasm still modest by historical standards. For adult undergraduates, the pre-pandemic 2019 baseline is much lower than the enrollment highs following the Great Recession.
Colleges and universities, therefore, cannot assume that economic woes will mean students come running. Just as the higher education innovations of the 1970s—such as the mainstreaming of co-education and part-time programs—changed the labor and postsecondary landscape, so today’s boom in online degrees, microcredentials, and registered apprenticeships offers prospective students more choice and flexibility.
High inflation and unemployment will persuade more Americans to invest in their educations. But colleges (and conventional programs) are not the only places to invest.
Eduventures has helped a growing number of clients think through hybrid strategies. Have an idea? Please get in touch.
Never Miss Your Wake-Up Call
Learn more about our team of expert research analysts here.
Eduventures Chief Research Officer at Encoura
Contact
Eduventures 2022 Higher Education Technology Landscape (Landscape) visualizes 367 vendors and their products, organized into over 44 separate market segments rolled up into four major categories aligned to the student lifecycle.
Throughout the year, we analyze these vendors and products and make that content available to clients. Several vendors have multiple products in their education technology portfolios.
The Program Strength Assessment (PSA) is a data-driven way for higher education leaders to objectively evaluate their programs against internal and external benchmarks. By leveraging the unparalleled data sets and deep expertise of Eduventures, we’re able to objectively identify where your program strengths intersect with traditional, adult, and graduate students’ values, so you can create a productive and distinctive program portfolio.