

June 14-16, 2023
Boston, MA
The pre-college market has been in the news lately. The National Student Clearinghouse reported that community college enrollment has finally picked up this spring, fueled in part by dual enrollment high schoolers. Advanced Placement, another common route to earning college credit, remains under the political spotlight given the recent controversy with Florida’s Governor.
Not to worry—Eduventures knows of some proxies that provide a good sense of scale and direction for those interested in sizing up this market.
What is the Pre-College Market?
Pre-college programming is designed to provide high school students the opportunity to prepare for life in college—like on-campus summer programs or earning college credit in high school. Indeed, there are many strands to the pre-college market and many terms are used, often interchangeably, when discussing it.
For example, dual enrollment, concurrent enrollment, and early college are all terms used to describe programs that allow high school students to earn college credit—and these are also the focus for this post.
Whatever you call it, there is a lack of robust, national data to indicate just how big this market is or how it is performing. As the College in High School Alliance (CHSA) underscored in its 2021 report, dual enrollment data is either old, inconsistent, or too general. This leaves the potential for gaps in analysis of this market – one that is increasingly important to understand as dual enrollment students show higher levels of college matriculation and success.
Fortunately, there are two proxies that provide a glimpse of this market: 1) non-degree/certificate-seeking undergraduate enrollment, and 2) under 18-year-old undergraduate enrollment.
Pre-College Market Demand Proxies
Proxy 1: Non-Degree/Certificate-Seeking Undergraduate Enrollment
According to NCES, the non-degree/certificate-seeking enrollment segment includes, but is not exclusive to, “dual enrollment” students—those who do not have a high school diploma but are enrolled in a high school diploma program while taking college-credit coursework. In fall 2021, there were 1.94 million enrolled students under this banner, which was 14% the size of degree/certificate-seeking undergraduate enrollment (13.9 million).
As shown in Figure 1, however, these two segments have performed quite differently over the last 10 years.
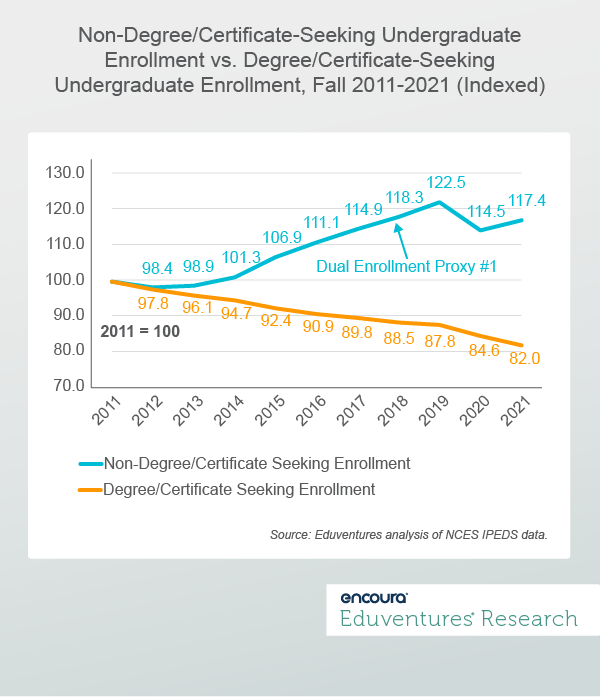
Between fall 2011 and 2021, non-degree/certificate-seeking undergraduate enrollment was up 17% compared to the 18% decline experienced by the degree/certificate-seeking segment. Of note, following a 2020 decline during the early peak of COVID-19, 2021 non-degree/certificate-seeking enrollment was up 3% in fall 2021 compared to a continued decline in the degree/certificate-seeking segment.
Proxy #2: Under 18 Undergraduate Enrollment
The second pre-college market proxy is the under 18 undergraduate enrollment cohort. NCES notes that reported undergraduate enrollment includes “high school students taking regular college courses for credit,” so limiting analysis to the under 18 age segment closely captures this high school group.
Figure 2 plots all available age cohorts for comparison.
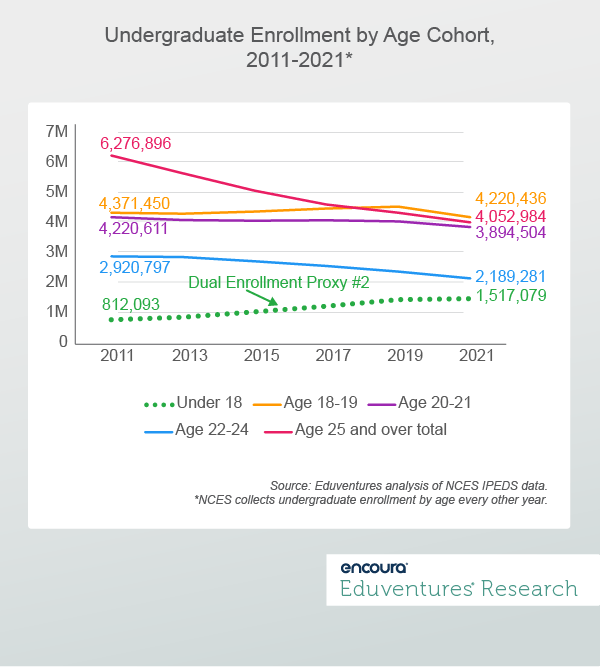
The under-18 segment, represented by the green dotted line, is the only undergraduate age cohort to grow over the examined timeframe, seeing an 87% increase. Of note, fall 2021 enrollment for this group only is above 2019 levels suggesting a potential rebound from 2020 (when data is unavailable). Looking back over the last two decades, the under 18 years of age segment is the only age cohort to grow between both 2001-2011 and 2011-2021.
While these proxies overlap, it is not exactly clear how they overlap through reporting. The under 18-year-old data is the more accurate proxy.
State Data
In addition to these two national dual enrollment proxies, certain states publish some of the best quality data around the pre-college market. Why? High schools are required by law (ESSA) to report data to their states on students taking accelerated coursework to earn postsecondary credit.
But even here, many argue that states can and should go further in building, tracking, and reporting on this data. Here are some states that stand out based on their most up-to-date data:
- Ohio’s College Credit Plus program saw course (not student) enrollments grow by 42% between academic years 2015-2016 and 2021-2022 with over 220,000 courses taken that last year.
- Kentucky’s Dual Credit student enrollment grew by 81% between academic years 2015-16 and 2021-22 topping 38,000 student participants in 2021-2022.
- Virginia saw close to a 50% increase in dual enrollment participation between fall 2015-16 and 2022-2023 with over 48,000 students participating last year.
- Texas’ dual credit enrollment grew from 112,361 in fall 2014 to 183,726 in 2020 – a 63% increase.
- Colorado’s Concurrent Enrollment program grew from 38,519 in 2015-2016 to 53,245 in 2019-2020 – a 38% increase – with 9th-12th grade student participation also rising from 14.8% to 19.2% during this period.
While some states report more detailed information than others, the common thread is that pre-college participation growth is clear.
The Bottom Line
Pre-college programming has been found to improve college matriculation rates and performance. For example, Colorado’s Department of Higher Education found that “students who attempted one or more Concurrent Enrollment credits in high school were dramatically more likely to matriculate to college within one year following high school graduation (77%) than those who did not (52%)” and that “those who took Concurrent Enrollment were significantly more likely to persist from fall-to-fall of their first year in college (82%) than those who did not (77%).”
On the other hand, more work needs to be done to ensure these programs reach beyond those who are already heading to college. In fact, experts have warned that pre-college programs may not be reaching low-income and other underserved students who could benefit most from them. While cost savings is a major benefit of pre-college, Ohio reports that only 17.8% of College Credit Plus participants were categorized as “economically disadvantaged” during the 2021-22 academic year. Though this is an improvement from 2015-16 (14.3%), there is still room to grow.
Ultimately, the growth in pre-college is an interesting counterpoint to the narrative that more and more high schoolers are skipping college. Of course, while college enrollment rates have indeed stumbled since COVID-19, pre-college might just be one of the tools required for a rebound.
Never Miss Your Wake-Up Call
Learn more about our team of expert research analysts here.
Eduventures Senior Analyst at Encoura
Contact
The Program Strength Assessment (PSA) is a data-driven way for higher education leaders to objectively evaluate their programs against internal and external benchmarks. By leveraging the unparalleled data sets and deep expertise of Eduventures, we’re able to objectively identify where your program strengths intersect with traditional, adult, and graduate students’ values, so you can create a productive and distinctive program portfolio.
Thursday, May 4, 2023, at 2pm ET/ 1pm CT
Over the past few years, graduate enrollment has continuously ticked upward growing by 12% between 2013 and 2021. However, based on National Student Clearinghouse estimates, fall 2022 brought us the first graduate enrollment decline in almost a decade. If graduate enrollment growth is no longer a guarantee, other market tensions—like increased program competition, proliferating non-degree programs, and a falling graduate enrollment rate—become much more acute challenges.
Join us for our upcoming webinar where Eduventures Senior Analyst Clint Raine will equip institutions with findings from the latest Eduventures Masters Market Update™ and successful master’s program innovation strategies.
