It’s that time of year again. With new classes safely on campus, enrollment managers now turn to deconstructing the prior year’s recruitment cycle. They review their efforts and fine tune their outreach, communications, and financial aid strategy for the next cycle. They pore over data in an effort to understand the mercurial 18-year-old mind and the equally mercurial undergraduate college enrollment decision.
They ask themselves: what, if anything, is the perception gap between those who chose to enroll in my school and those who were close to enrolling but chose to enroll elsewhere? This is the critical gap to monitor, since small changes in recruiting practices and improved communications might just make the difference in converting fence-sitting students.
Consider the following brand perception map based on data from one public university’s 2016 Survey of Admitted Students. It provides a visual representation of brand attributes which we see in many public institutions. In the example below, attributes that are commonly shared among public institutions appear in the space between enrollment categories (e.g. Enrolling, Close-to-Enrolling, and Not-Close-to-Enrolling), while attributes that are held more strongly by one category of enrollment decision appear along the edges of the maps. The closer an attribute is to an enrollment category, the more closely this perception is held relative to other enrollment categories.
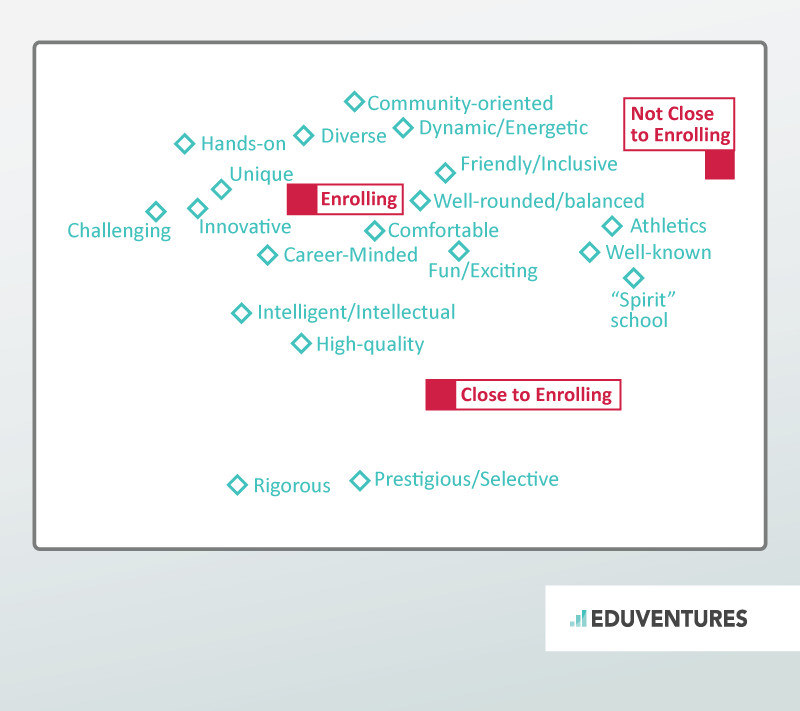 What’s striking is the constellation of associations that Enrolling students have in comparison to those held by students who are either Close-to-Enrolling or Not-Close-to-Enrolling. Not only are Enrolling students’ attribute associations dense—Enrolling students on average make 11 attribute associations to the admitting institution, compared with nine for those Close-to-Enrolling and seven for those Not-Close-to-Enrolling—the nature of these associations is quite different.
Enrolling students at this large public institution have warm, personal, and engaging attribute associations, while Close-to-Enrolling students have positive, but sterile, associations. For example, even though both Enrolling and Close-to-Enrolling students think of the institution as “intelligent/intellectual” and “high quality,” Enrolling students think of it as “challenging” while Close-to-Enrolling students think of the institution as “rigorous” or “prestigious.”
Students who were Not-Close-to-Enrolling picked up on surface perceptions, or stereotypes, that many large publics share like “athletics” and “spirit school.” They don’t associate perceptions of quality, warmth, or energy with “well-known,” possibly in the same way your kindly grandmother would describe her disagreeable neighbor as “nice.”
While the pattern for private institutions is similar, there are notable differences. In the example of a medium-sized private institution, we see the same density of energetic associations that Enrolling student students make—a combination of challenge, career-mindedness, energy, intellect, innovation, community, and fun.
What’s striking is the constellation of associations that Enrolling students have in comparison to those held by students who are either Close-to-Enrolling or Not-Close-to-Enrolling. Not only are Enrolling students’ attribute associations dense—Enrolling students on average make 11 attribute associations to the admitting institution, compared with nine for those Close-to-Enrolling and seven for those Not-Close-to-Enrolling—the nature of these associations is quite different.
Enrolling students at this large public institution have warm, personal, and engaging attribute associations, while Close-to-Enrolling students have positive, but sterile, associations. For example, even though both Enrolling and Close-to-Enrolling students think of the institution as “intelligent/intellectual” and “high quality,” Enrolling students think of it as “challenging” while Close-to-Enrolling students think of the institution as “rigorous” or “prestigious.”
Students who were Not-Close-to-Enrolling picked up on surface perceptions, or stereotypes, that many large publics share like “athletics” and “spirit school.” They don’t associate perceptions of quality, warmth, or energy with “well-known,” possibly in the same way your kindly grandmother would describe her disagreeable neighbor as “nice.”
While the pattern for private institutions is similar, there are notable differences. In the example of a medium-sized private institution, we see the same density of energetic associations that Enrolling student students make—a combination of challenge, career-mindedness, energy, intellect, innovation, community, and fun.
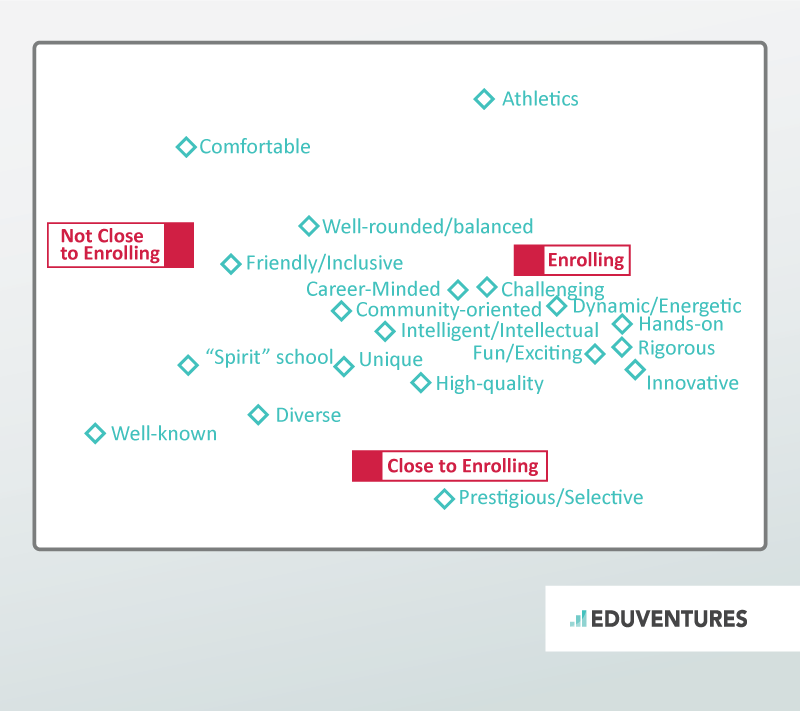 Close-to-Enrolling students certainly think the institution is prestigious, but retain some level of distance in their knowledge of the institution. While Not-Close-to-Enrolling students admitted to public institutions saw the stereotypical aspects of publics, Not-Close-to-Enrolling students admitted to private institutions see the simple stereotype of a many privates—“friendly/inclusive” and “well-rounded/balanced.”
While each of the institutions that participated in Eduventures 2016 Survey of Admitted Students has its own distinctive map, the similarities in perception patterns within publics and privates are instructive. These perceptual maps reveal that it is not enough for a student to have a good impression of your institution; they must have a warm, energetic relationship with the institution. Being well-regarded is better than being well-known. Being well-loved is even better.
It’s possible that the density of associations enrolling students have are caught up in a “chicken and egg” cycle of indeterminate cause and effect. Are enrolling students predisposed to greater knowledge of the institution or did these institutions create a greater depth of knowledge through recruiting and communications? It’s hard to say exactly, but it’s likely that both are true to varying degrees.
Across all participating institutions, both public and private, 43% of Non-Enrolling students were “very or extremely close” to enrolling at the institution. In other words, the school was one of their top choices, yet they decided to attend elsewhere. Certainly, affordability is a relevant reason for this choice. More than a quarter of non-enrolling students (29%) say that affordability was the top driver of their choice. That, however, may not account for a vast majority choosing to attend for other reasons that may be influenced by better recruiting and communications.
These perceptual maps provide evidence that your yield campaign should address several issues:
Close-to-Enrolling students certainly think the institution is prestigious, but retain some level of distance in their knowledge of the institution. While Not-Close-to-Enrolling students admitted to public institutions saw the stereotypical aspects of publics, Not-Close-to-Enrolling students admitted to private institutions see the simple stereotype of a many privates—“friendly/inclusive” and “well-rounded/balanced.”
While each of the institutions that participated in Eduventures 2016 Survey of Admitted Students has its own distinctive map, the similarities in perception patterns within publics and privates are instructive. These perceptual maps reveal that it is not enough for a student to have a good impression of your institution; they must have a warm, energetic relationship with the institution. Being well-regarded is better than being well-known. Being well-loved is even better.
It’s possible that the density of associations enrolling students have are caught up in a “chicken and egg” cycle of indeterminate cause and effect. Are enrolling students predisposed to greater knowledge of the institution or did these institutions create a greater depth of knowledge through recruiting and communications? It’s hard to say exactly, but it’s likely that both are true to varying degrees.
Across all participating institutions, both public and private, 43% of Non-Enrolling students were “very or extremely close” to enrolling at the institution. In other words, the school was one of their top choices, yet they decided to attend elsewhere. Certainly, affordability is a relevant reason for this choice. More than a quarter of non-enrolling students (29%) say that affordability was the top driver of their choice. That, however, may not account for a vast majority choosing to attend for other reasons that may be influenced by better recruiting and communications.
These perceptual maps provide evidence that your yield campaign should address several issues:
Example University: Brand Perception Map of a Public Institution by Enrollment Status
What’s striking is the constellation of associations that Enrolling students have in comparison to those held by students who are either Close-to-Enrolling or Not-Close-to-Enrolling. Not only are Enrolling students’ attribute associations dense—Enrolling students on average make 11 attribute associations to the admitting institution, compared with nine for those Close-to-Enrolling and seven for those Not-Close-to-Enrolling—the nature of these associations is quite different.
Enrolling students at this large public institution have warm, personal, and engaging attribute associations, while Close-to-Enrolling students have positive, but sterile, associations. For example, even though both Enrolling and Close-to-Enrolling students think of the institution as “intelligent/intellectual” and “high quality,” Enrolling students think of it as “challenging” while Close-to-Enrolling students think of the institution as “rigorous” or “prestigious.”
Students who were Not-Close-to-Enrolling picked up on surface perceptions, or stereotypes, that many large publics share like “athletics” and “spirit school.” They don’t associate perceptions of quality, warmth, or energy with “well-known,” possibly in the same way your kindly grandmother would describe her disagreeable neighbor as “nice.”
While the pattern for private institutions is similar, there are notable differences. In the example of a medium-sized private institution, we see the same density of energetic associations that Enrolling student students make—a combination of challenge, career-mindedness, energy, intellect, innovation, community, and fun.
Example: Brand Attribute Map of a Private Institution by Enrollment Status
Close-to-Enrolling students certainly think the institution is prestigious, but retain some level of distance in their knowledge of the institution. While Not-Close-to-Enrolling students admitted to public institutions saw the stereotypical aspects of publics, Not-Close-to-Enrolling students admitted to private institutions see the simple stereotype of a many privates—“friendly/inclusive” and “well-rounded/balanced.”
While each of the institutions that participated in Eduventures 2016 Survey of Admitted Students has its own distinctive map, the similarities in perception patterns within publics and privates are instructive. These perceptual maps reveal that it is not enough for a student to have a good impression of your institution; they must have a warm, energetic relationship with the institution. Being well-regarded is better than being well-known. Being well-loved is even better.
It’s possible that the density of associations enrolling students have are caught up in a “chicken and egg” cycle of indeterminate cause and effect. Are enrolling students predisposed to greater knowledge of the institution or did these institutions create a greater depth of knowledge through recruiting and communications? It’s hard to say exactly, but it’s likely that both are true to varying degrees.
Across all participating institutions, both public and private, 43% of Non-Enrolling students were “very or extremely close” to enrolling at the institution. In other words, the school was one of their top choices, yet they decided to attend elsewhere. Certainly, affordability is a relevant reason for this choice. More than a quarter of non-enrolling students (29%) say that affordability was the top driver of their choice. That, however, may not account for a vast majority choosing to attend for other reasons that may be influenced by better recruiting and communications.
These perceptual maps provide evidence that your yield campaign should address several issues:
- Know who is on the fence – Yield efforts will be most effective if you devote more of your resources toward moving Close-to-Enrolling students off the fence. In order to do this, you have to know who they are. Consider using predictive enrollment scoring, developed in-house or with an external partner, in order to identify fence-sitters.
- Build and deepen the relationship beyond the cold hard facts – Knowing the cold hard facts about an institution is certainly important to an admitted student, but this is foundational information upon which you need to build a deeper relationship. As you move through the yield phase, carefully consider the type of information and engagement that will help students understand how the full institutional context.
- Engender excitement – In your yield planning, pay attention not just to content but also to voice and tone of messaging. Does it feel authentic? Are you warm and welcoming? Is it distinctive to your institution? Does it meet the expectations of the kinds of students your institution seeks to attract?
- Create personal meaning –Eduventures’ Prospective Student Mindsetsdemonstrated that students imagine different pathways, experiences, and outcomes from their college education. Do your yield events and communications speak to the mindsets that you care about the most? Can you deliver differentiated, but authentic information that illuminates specific pathways to key student mindsets?