The landscape for undergraduate enrollment isn’t fair. Some institutions get all the students while others struggle to make enrollment. Certainly, regional markets for first-time undergraduates are heavily influenced by geo-demography. But geo-demography isn’t the only determinant. Institutional brand and the “X factor” of organizational leadership, program offerings, and market presence create “have” and “have not” institutions.
What can a deeper dive into the enrollment data tell us about which institutions are able to create that “X factor,” whatever their market conditions may be?
In a recent Wake-Up Call, we noted that while the entire market for first-time, degree seeking undergraduates is down 10% since 2009, the nonprofit four-year sector is up 7% in enrollment. In other words, it’s the for-profit and community college sectors that have seen macro-level enrollment losses.
That rise for the four-year nonprofit sector, however, has slowed tremendously in comparison to the prior time period. The work required to gain enrollment has gotten harder and harder.
Within that 7% growth is a more detailed story of complex competitive forces at play. There are institutions that have seen enrollment growth, those that have seen declines, and those that have stayed the course. Some institutions have managed their enrollment situations with great intentionality and others have been caught in the winds of change.
This week, we examine the four-year nonprofit sector at a deeper level in order to tease out the nature of these competitive markets. Figure 1 maps the growth in four-year public institutions over the past 10 years. Taken with Figure 2, it shows that the declining fortunes of many American families after the great recession created a shift of first-time undergraduate enrollment toward public institutions. As a result, Figure 2 will confirm that .
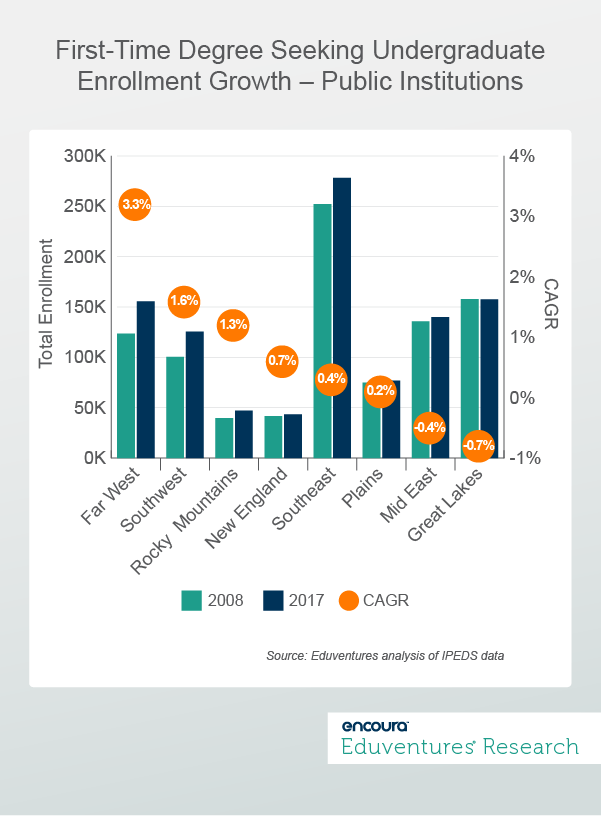
It also shows that in most regions, the growth rates are positive. Institutions in the Far West and Southwest have seen especially rapid growth, no doubt driven by the burgeoning population of states like California and Texas. Public institutions in the Mid East and Great Lakes are facing demographic and other headwinds, though. These institutions, on average, have negative enrollment growth rates.
We can examine the same enrollment trends for private institutions in Figure 2.
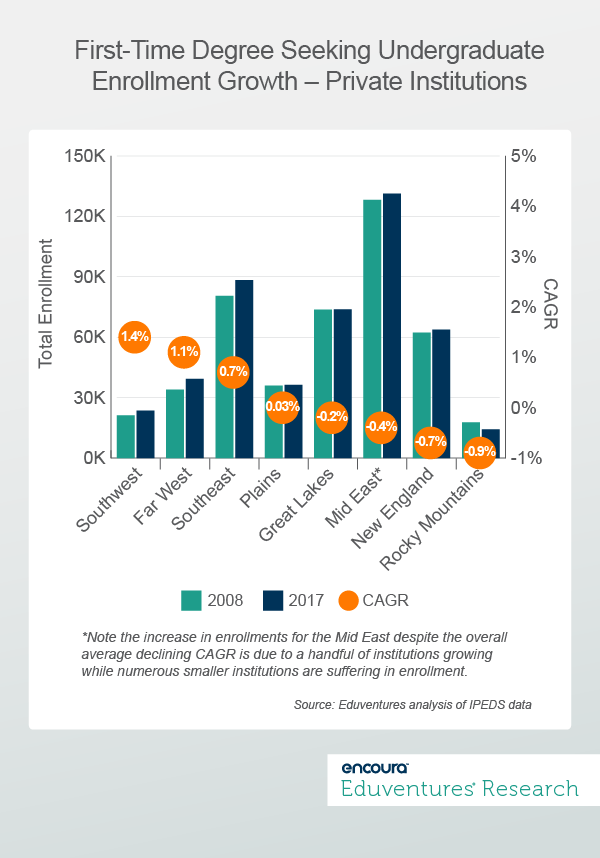
The corollary story for private institutions since the Great Recession—as a sector—is an enrollment decline. Yet some regions with population growth are still seeing growth.
The Far West and Southwest are also driving enrollment growth in this sector, along with the Southeast. But this shows the pain of declining enrollment being felt by more institutions in more regions of the country. Institutions in four regions—the Great Lakes, Mid East, New England and Rocky Mountains—are all seeing enrollment declines.
The Haves and Have Nots
The tale we want to tell, however, is that no matter what market your institution is operating in—a growing expansive market, or a declining one—there are institutions that are successfully adapting to market conditions and those that are not. This current environment of hard work for hard won enrollments results in “have” and “have not” institutions—those that gain the enrollment they seek and those that are left behind.
To illustrate, let’s look at each of these regions based on their compound annual growth rates (CAGR) for first-time undergraduate enrollment between 2008 and 2017 (Figure 3).
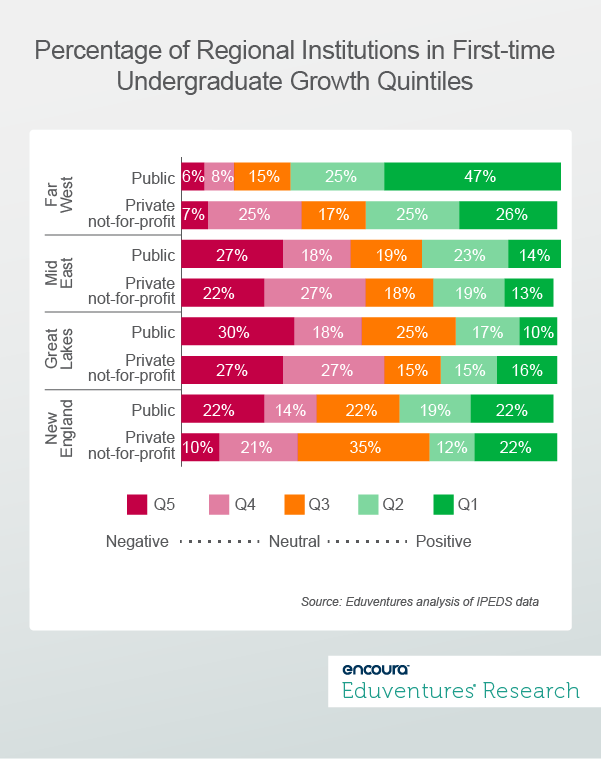
Institutions in the Q1 quintile are the top performers, while those in the bottom quintile, Q5, are in enrollment decline. The middle quintile (Q3) represents institutions that have stable enrollments. (Ed. Note: while we are comparing institutions regionally, the quintiles themselves are based on performance nationally.)
To be sure, within this story there are some institutions that want to stay the same size or right size (they are generally small in number), but that’s a story for another day. For now, let’s focus on growth.
Far West
Nearly three quarters (72%) of Far West publics are in the top two growth quintiles nationally. About half (51%) of Far West privates are in these top growth categories, too. This tells us that the Far West market is wide open for enrollment growth.
In this market, some standout institutions have accelerated their enrollments over the past decade. These include University of Washington’s Bothell and Tacoma campuses, University of California - Merced, CSU - Los Angeles, CSU - San Marcos, and CSU - Channel Islands.
Additionally, private institutions have also grown, including Chapman University, University of Laverne, and California Baptist University. There are many more institutions in this region that have benefited from both population growth and the policy decisions of the University of California System and California State University System.
Yet still, despite the positive market conditions, 14% of publics and 31% of privates in the Far West are in the bottom two growth quintiles nationally. There are few of them, but they are struggling more than their peers—institutions like Evergreen State University, Hawaii Pacific, and Simpson University.
Great Lakes
In contrast to the Far West, the Great Lakes exists in a far more challenging environment. Less than a third of both public (27%) and private (31%) institutions are growing. These include public institutions like Indiana Institute of Technology, Cleveland State University, and University of Cincinnati, as well as Aurora University and University of Indianapolis among privates.
But many more are finding the road ahead difficult. About half of both publics (48%) and privates (54%) find themselves facing declining first-time undergraduate enrollment scenarios. These institutions are numerous. They include Robert Morris University in Illinois, Cardinal Stritch University, Saginaw Valley University, and Eastern Illinois University, among others.
In reality, these universities are all seeking new strategies, many of which include incorporating non-traditional students into their enrollments (these numbers aren’t reflected in this particular data). What this data does show us is the vastly different fortunes of institutions in different regional markets. It also shows us that, even under challenging market conditions, some rise to the occasion and others do not.
The Bottom Line
In a shrinking market for first-time undergraduates, every institution must understand the powerful forces of geo-demographics at work in their recruiting markets. To really navigate the enrollment environment successfully, each institution has to master the “X factor” of organizational leadership, strategy, and execution.
What can your institution do to make sure that you are one of the institutions that gets ahead? Here are some big-picture thoughts:
- Know your market dynamics. Use data to understand the market in which you operate. We examined it at a broad regional level here, but you can be more granular, or you can consider other dimensions of your market that are not related to geography.
- Understand your competitive position in that market. Examine the flow of enrollment to your institution, but also to key cross applicant and admitting institutions. Understand which institutions are gaining or losing market share for the same students you are trying to enroll.
- Develop a realistic strategy for your market. Let the data inform your enrollment goals in clear-eyed and realistic ways. You won’t magically find enrollment that isn’t there; gains come from detail-work and are hard won.
- Get to know what first-time undergraduates really want. The more connected your institution is to the desires and needs of prospective students, the better you can build, market, and recruit them into your programs.
The good news is that the market for first-time undergraduates has been slowly growing. There are students out there who want to enroll in the college of their dreams. Some institutions will get it right and be among the “haves.” Those who don’t will find themselves among the “have nots.”
We’ll be able to answer any questions you have around:
- Receiving the ACT Test Scores Sent to You by Students
- Transitioning ACT EOS Ordering System from Enroll to Encoura Data Lab
- Launching the New Encoura Class Planner™ App
- Release Dates
Thank you for subscribing!
Thank you for subscribing!