

Here we are—halfway through December. If you’re like me, you haven’t finished your holiday shopping, and you’re still drumming up compelling New Year’s resolutions. On top of all that, you’re not ready for college football bowl season to start this Saturday. Don’t worry, we’ve got you covered (on the football, at least).
Get ready for bowl season by checking to see if your team made our second annual Eduventures Top 25 College Football Retention Ratings. Our methodology uses linear regression to score each institution’s actual retention rate against a statistically predicted metric that estimates how it should perform based on academic, social, environmental, and financial indicators. We then ranked the institutions with Division I football teams by the difference between their predicted and actual retention rates to identify the Eduventures Top 25.
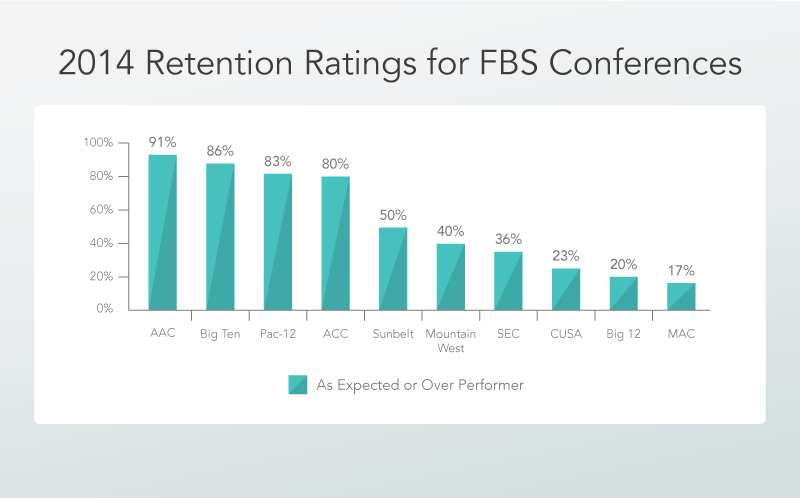
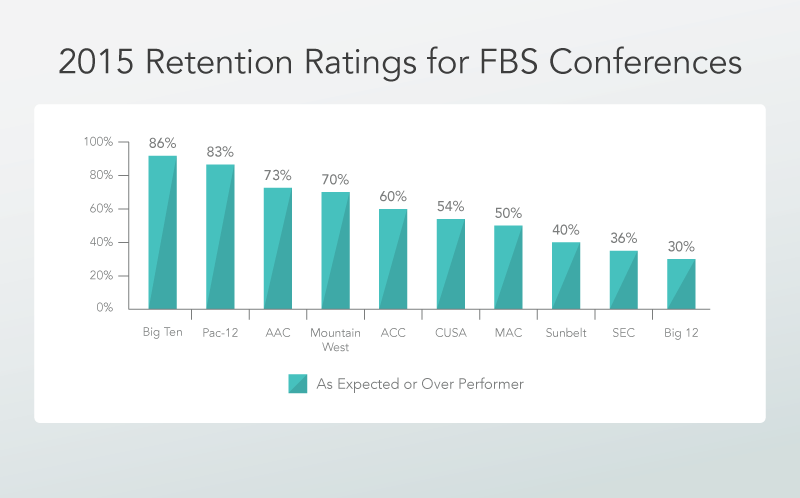 The Big Ten is the strongest performing conference, and the Pac-12 is close behind. In both conferences, the same percentage of institutions performed at or above our predicted retention rate in 2014 and 2015. The equally impressive Mountain West (40% to 70%), Conference USA (23% to 54%), and the MAC (17% to 50%) also demonstrated dramatic year-over-year improvements. On the other hand, the AAC fell from its top standing last year, when over 90% of institutions performed at or above our expected retention rates, to fifth place in 2015, when only 73% of institutions met or exceeded our expected rates. The ACC also saw a significant drop, from 80% to 60%. While the Big Ten is the top conference for retention, we’ll have to see which conference has the champion at the end of the football season.
Eduventures Top 25 List
Drumroll, please. For the second consecutive year, Fresno State ranks first in our retention ratings with an actual retention rate that is 12% higher than its predicted retention rate. This is quite a feat, considering the strong competition from 12 new institutions on the list. For the second year in a row, San Jose State University, University of South Florida, Georgia State University, and UCLA continued relative retention improvements and placed in the top 10. As you might expect, the list of Eduventures Top 25 Retention Performers looks very different from the College Football Top 25 list. Only seven institutions—University of Florida, Florida State University, University of Houston, Michigan State University, Oregon State University, Temple University, and University of Utah—outperformed competitors both on and off the field to claim a spot on both Top 25 lists. While most of these institutions were in both rankings last year, Temple and Houston are new to both lists. They outperformed their predicted retention rates by 4% and 7%, respectively, and improved subpar football records, equally impressive feats.| RANK | TOP 25 2015 | TOP 25 2014 |
|---|
| 1 | Fresno State | Fresno State |
| 2 | San Jose State University | UCLA |
| 3 | University of Utah | San Jose State University |
| 4 | San Diego State University | University of South Florida |
| 5 | University of South Florida | Troy University |
| 6 | Temple University | University of Florida |
| 7 | Georgia State University | University of Georgia |
| 8 | Old Dominion University | Georgia State University |
| 9 | UCLA | Ohio State University |
| 10 | Syracuse University | University of Southern California |
| 11 | University of Wisconsin | Florida State University |
| 12 | Michigan State University | University of California-Berkeley |
| 13 | North Carolina State University | Temple University |
| 14 | University of Florida | San Diego State University |
| 15 | Florida International University | University of North Carolina |
| 16 | Florida State University | University of Washington |
| 17 | University of Washington | University of Central Florida |
| 18 | University of Georgia | Texas A & M University |
| 19 | Oregon State University | Eastern Michigan University |
| 20 | University of Houston | Florida International University |
| 21 | University at Buffalo | University at Buffalo |
| 22 | East Carolina University | The University of Texas at Austin |
| 23 | University of Oregon | University of Illinois |
| 24 | Pennsylvania State University | Arizona State University |
| 25 | University of Central Florida | Michigan State University |
Top Ranked College Football Conferences
In addition to the Eduventures Top 25, we also ranked the major college football conferences to see how they stacked up in the retention ratings. Since we last ranked conferences by retention performance in 2014, there have been some significant shifts.
The Big Ten is the strongest performing conference, and the Pac-12 is close behind. In both conferences, the same percentage of institutions performed at or above our predicted retention rate in 2014 and 2015. The equally impressive Mountain West (40% to 70%), Conference USA (23% to 54%), and the MAC (17% to 50%) also demonstrated dramatic year-over-year improvements. On the other hand, the AAC fell from its top standing last year, when over 90% of institutions performed at or above our expected retention rates, to fifth place in 2015, when only 73% of institutions met or exceeded our expected rates. The ACC also saw a significant drop, from 80% to 60%. While the Big Ten is the top conference for retention, we’ll have to see which conference has the champion at the end of the football season.
