What makes a great online course? How much of a course should be devoted to student engagement with content versus time with faculty, other students, and support staff? Our latest CHLOE report, published today, offers some insights.
CHLOE, short for the Changing Landscape of Online Education, is a partnership between Eduventures and Quality Matters that focuses on online learning strategy, policy, and operations. The third CHLOE survey garnered responses from online learning leaders at 280 colleges and universities nationwide, a 54% increase from year two.
In this Wake-Up Call, we highlight a key finding from CHLOE 3—
Let’s start with how online students spend their time. The CHLOE 3 survey asked online leaders—who we call chief online officers—to estimate, for a typical online course at their institutions, the proportion of student time spent interacting with content, faculty, other students, and other staff. Overall, across the sample, online leaders offered the following breakdown (Figure 1).
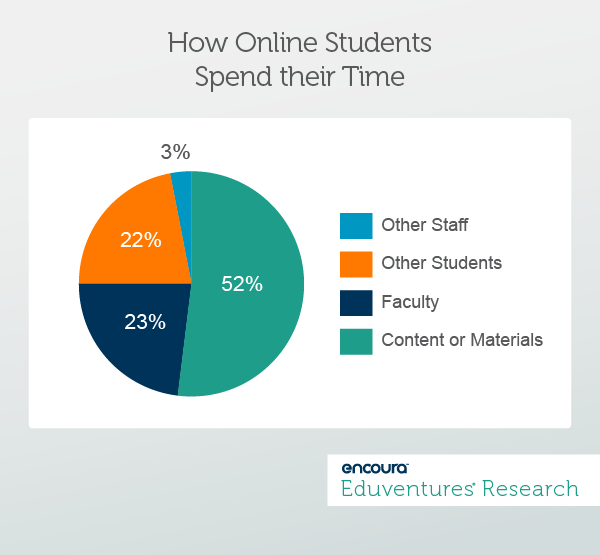
Perhaps surprisingly, this distribution varied little by institutional type, whether online giants, regional privates, or community colleges. But behind the averages, some institutions presented quite different ratios.
The highest percentage for "content or materials" was 100%, implying an entirely self-paced experience. For “other students” interaction, the highest percentage was 80%. This suggests a peer-learning approach, with the faculty member in a supporting role. For "faculty" interaction, the top percentage was 70%, consistent with a more traditional, synchronous set-up. The “other staff” proportion climbed as high as 30% at an institution known for a personalized mentor approach.
These extremes serve as a reminder of the possibilities of online learning, and of teaching and learning generally.
The majority of schools regard materials as the main thing with which students engage in an online course. But more than a third (35%) provided a percentage below half. Only one CHLOE 3 respondent said online students do not interact with materials at all, implying an approach dedicated to class participation or practical application. Indeed, this is a performing arts school.
About half the sample said interaction with faculty accounted for 20% or less of student course time. A bit more than half offered a similarly low percentage for peer interaction.
How to evaluate these distributions? The mix of time devoted to content, faculty, etc., must be related to fundamentals like course quality and student outcomes. Equally, just knowing the average time distribution says little about the actual student experience. One class may be much more engaging and valuable than another, regardless of time allocation.
CHLOE 3 also found an intriguing association between online course design and time distribution. Ten percent of chief online officers we surveyed said that at their institution’s faculty design courses independently; 38% say faculty take the lead with optional instructional designer (ID) support; 24% say faculty must work with an ID; and 9% cite a team-based approach consisting of faculty, IDs, and other specialists. The rest outsource course design or have no common approach.
Figure 2 cross-references online course design approach and online student time distribution.
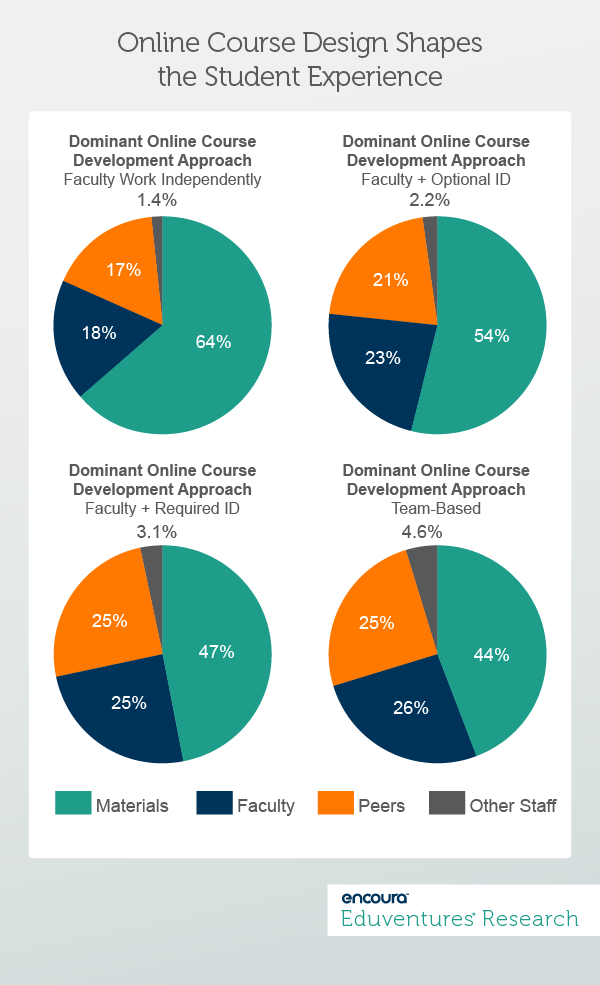
Figure 2 suggests a positive association between a more systematic and team-based approach to online course design and a more rounded and diverse student experience. It may be counter-intuitive that when faculty design online courses by themselves, student time with faculty is below average. Contrary to the stereotype that online courses mean a diminished role for faculty, Figure 2 points to the opposite.
Perhaps individual faculty who go solo with online course design are disproportionately employed at institutions with little online learning experience and infrastructure. Many such faculty may be disconnected from the online learning literature and good practice. Perhaps some faculty in fact see online as a way to reduce workload, and design accordingly in favor of student engagement with content.
Online course design rubrics have been around for many years and are widely used. Indeed, our CHLOE partner, Quality Matters, offers what is perhaps the best known such rubric. These rubrics tend to deal in principles rather than prescribing exactly what an online course should consist of.
For example, when it comes to student interaction, rubrics might emphasize the value of a variety of communication channels and multiple opportunities for students to use them. But prescribing, say, how much time students should spend interacting with faculty versus content is not seen as appropriate. Field of study, a student’s level, and other variables—not least individual faculty style and preference—inhibit any simple formula.
The challenge, of course, is that Figure 2 represents chief online officer perceptions of their online courses. Online course design rubrics also tend to focus on how a course should work rather than how it actually works once students are enrolled. Reviewing every live iteration of every course is not practical. Chief online officers may persuade themselves that their hard-won investment in instructional design or a team-based approach are paying off, or they may confuse online course design policy with student reality.
The Bottom Line
An interesting next step for a chief online officer would be to seek the input of colleagues about how student time is spent in the institution’s online courses. Is there consensus? Another option is to look at actual student interaction in a sample of online courses. Does reality match perception?
We are currently drafting the CHLOE 4 survey and seeking greater definition for different types of student interaction. It will be interesting to see whether the interaction distribution shifts this time next year.
Like any course, the reality of an online course is part design, part implementation, and part the wild cards of individual faculty, students, subject matter, and time. Design rubrics, surveys such as CHLOE, and the examination of live online courses all help clarify and advance what we mean by online learning quality. Thinking about the mix of student interaction with content, faculty, other students, and other staff in their online courses might be a useful exercise for schools.
As online continues to grow in popularity, and program portfolios grow larger and more diverse, CHLOE data supports the idea that a systematic and multi-actor design approach is more likely, other things being equal, to result in a superior online learning experience.
CHLOE 3: Behind the Numbers, is the third in a series of annual reports based on a survey of chief online officers from all sectors of U.S. higher education. In its third year, the annual CHLOE survey grew to 280 chief online officer responses from 182 in the previous survey – a 54% increase – further expanding the range and variety of institutional responses and increasing the representativeness of the results. As online learning continues to increase in scale and scope in higher education, CHLOE shines a light on the strategic and operational side of online learning, helping leaders and practitioners better understand trends and developments.
Presented by Richard Garrett, Eduventures Chief Research Officer, ACT | NRCCUA and Ronald Legon, Executive Director Emeritus, Quality Matters, the webinar will discuss enrollment trends, the typical structure of online courses, institutional governance practices for online programs, and analysis of online quality assurance as a process.
Thank you for subscribing!