Surveying your own admitted students is inarguably valuable, especially at a time of declining first-time student enrollment. But sometimes, the self-selecting nature of your admitted student body—who were all interested enough to apply to your institution in the first place—can mask greater market forces at play. For instance, do you know why, like many institutions, the difficulty of attracting students in your key markets has increased?
That is exactly what a small liberal arts institution in the Northeast was wondering after a lackluster recruitment season.
The Power of Numbers
Many institutions opt to administer admitted student surveys that are highly customized to them. Since every school is different, this makes sense, but few consider the downside: the lost ability to benchmark. Further, if list sizes or response rates are low, as can easily happen at smaller schools, the insights may feel less generalizable.
Below are two examples of how national admitted student data provided new—and sometimes surprising—insight into students in their key target markets. These insights come from Eduventures’ national Admitted Student Research™ dataset, which grew by more than 43,000 admitted students in 2021.
Scenario 1: Finding Students in a Competitive, Crowded Market
The first analysis was completed for a small liberal arts institution in the Northeast that, like many schools, is struggling to attract and enroll students in the current environment. This institution heavily targets students from New Jersey, with emphasis on specific zip codes. To understand these particular students, Eduventures segmented our Admitted Student Research data by students in the target zip codes and benchmarked it against all students in the state and nationally.
While the institution had a solid understanding of enrollment trends among schools it has traditionally considered to be its immediate competitors (largely private liberal arts colleges), seeing the application and enrollment schools of students in its target New Jersey zip codes provided some surprises. Figure 1 shows where students in the school’s target market planned to apply (left column), where they were admitted (middle column), and the schools they ultimately chose (right column).
Figure 1. Application, Cross-Admit, and Enrollment Schools of Students in New Jersey Target Markets
| Application Interest* (Where students in the target market plan to apply) | Cross Admit Schools * (Where students in the target market were admitted) | Enrollment School (Where students in the target market ultimately enrolled) | |||
|---|---|---|---|---|---|
| New York University | 30% | Rutgers University-New Brunswick | 11% | Rutgers University-New Brunswick | 11% |
| Columbia University | 17% | Montclair State University | 3% | The College of New Jersey | 3% |
| Yale University | 13% | University of Delaware | 2% | New Jersey Institute of Technology | 3% |
| Community College | 12% | The College of New Jersey | 2% | Northeastern University | 3% |
| Harvard University | 11% | Northeastern University | 2% | Community College | 2% |
| University of Michigan-Ann Arbor | 8% | The University of Tampa | 2% | The University of Tampa | 2% |
| Stanford University | 6% | New Jersey Institute of Technology | 2% | Montclair State University | 2% |
Source: Eduventures 2021 Prospective Student Research™ and 2021 Admitted Student Research™
*Respondents were able to list up to four institutions. Percentages do not add up to 100.
This competitive list reveals that prospective students in the New Jersey target market considered applying to a highly aspirational set of schools—a recent trend we have also observed nationally. The top schools considered are almost exclusively Ivy Leagues and other selective schools. More importantly, nearly all are outside of New Jersey.
Looking at the schools where target market students were accepted and enrolled, however, reveals that many decided to attend an in-state institution after all. Overall, public institutions dominated this market in 2021 (another national trend and subject of a forthcoming Wake-Up Call). While students in the target market were indeed somewhat more likely to apply to and attend a private institution compared to all New Jersey students, they seemed to prefer larger private schools like Northeastern University over small liberal arts schools. This likely contributed to the decline in applications and yield.
Understanding that the true competition in this school’s target market is not the other liberal arts institutions they track using National Student Clearinghouse (NSC) data, but rather selective in-state, public schools or large out-of-state private institutions, this institution realized they should emphasize academic quality and value to attract students and possibly also consider new, more promising target markets.
Scenario 2: The Special Focus School
Enrollment scenarios can look quite different for special focus institutions. Often drawing very specific types of students nationally, it is important for these institutions to understand why they may choose a school like theirs or why they may prefer a school with a broader academic portfolio that offers a more traditional student experience. In our next example, Eduventures examined our national Admitted Student Research data to help an art school uncover the enrollment drivers of students who chose to attend a special focus art institution compared to those who plan on studying an art-related major but preferred to enroll at a non-specialized school.
Figure 2 below illustrates the key enrollment drivers of these two student segments compared to the national benchmarks.
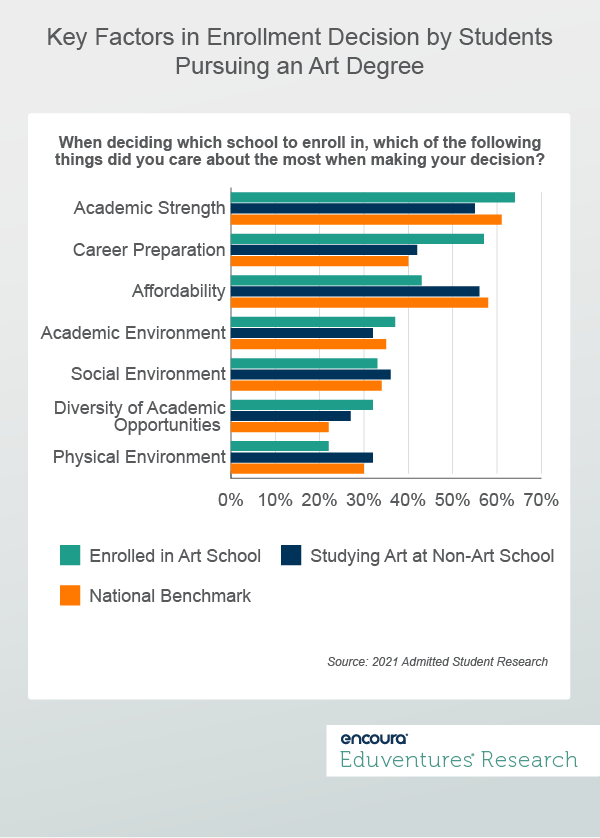
Figure 2 shows that for students who chose to enroll in an art school, academic strength, career preparation, and affordability mattered the most in their enrollment decisions. Compared to students who plan to study an art-related field at a non-art school, those who chose an art school placed more emphasis on academic strength and career preparation. Students at non-art schools who were interested in studying an art field generally mirrored the enrollment behaviors of their national peers, focusing more on affordability than career preparation.
Interestingly, while art school students were far more driven by career preparation, they reported more interest in majors without a strong career articulation compared to art students at non-art schools—think general art studies vs. fashion design/merchandising. This suggests that students who choose art schools see value in this type of school in the perception of strong academics in their chosen fields—but they put the onus on their schools to help them figure out what to do with their degrees. This means that tying academic excellence with career outcomes is imperative for specialized art school recruitment.
The Bottom Line
These are just two examples of how using admitted student data beyond your institution-specific responses can help you better understand your broader market—and how to position yourself more competitively within it. While it is of course always important to understand your specific admit pool and its motivations, looking at admitted student data differently will also allow you to examine how well your institutional value proposition aligns with student priorities in your target markets.
Never Miss Your Wake-Up Call
Learn more about our team of expert research analysts here.
Eduventures Senior Analyst at Encoura
Contact
Thursday, Feb 17 at 2pm ET
What will the 2022 yield season hold? This question is on every enrollment management and admissions officer's minds as we are eagerly awaiting enrollment deposits. The path ahead remains cloudy, but previous enrollment indicators can serve as a beacon for future enrollment behavior. Join us as we are mining Eduventures’ vast admitted student database for five indicators that can help us predict what the future has in store for your institution.
We will explore how different categories of higher education institutions have fared between 2019 and 2021, and predict what will happen in the spring based on five indicators:
- Type of enrollment schools: Who is benefitting from the current environment, and who will have to work harder to meet their goals?
- Enrollment reasons: How has the pandemic changed student priorities for their enrollment decisions?
- Admitted Student Mindsets™: Are your admitted students thinking differently about their pathways through college than they did before?
- Distance: How far are students willing to travel for your type of institution?
- Demographics: Which students are enrolling, who is pausing their college plans, and what does that mean for your institution?
This recruitment cycle challenged the creativity of enrollment teams as they were forced to recreate the entire enrollment experience online. The challenge for this spring will be getting proximate to admitted students by replicating new-found practices to increase yield through the summer’s extended enrollment cycle.
Eduventure’s Admitted Student Research delivers essential insights for you and your enrollment management team to:
- Learn what your applicant pool thinks about your institution and your competitors
- Make data-driven decisions to improve programming, communication, and financial aid
- Tailor your recruitment and yield strategy holistically and for specific student types
- Understand how students are engaging in social media throughout the enrollment process.
Never Miss Your Wake-Up Call
Learn more about our team of expert research analysts here.