Drawing on Eduventures’ 20-plus years of experience helping universities develop, launch, and assess academic programs, the Program Spotlight Series of Wake-Up Calls calls attention to best practices in program development.
2019 IPEDS data shows Master’s programs now make up nearly 16% of completions across all levels of U.S. higher education. For several years, this market has been the primary sector of growth for many institutions—led in large part by the development of online programs.
In October, the National Center for Education Statistics (NCES) released new data about the number of academic programs offered in specific fields of study and how many students completed those programs for the 2017–2018 school year. As a critical dataset for anyone interested in the health of online master’s programs, we’ve done some initial analysis.
?
The Survey Says: Number of Online Master's Programs and Students Completing Them Grows Again, but at a Lower Rate than Previous Years
Another year of NCES distance data—our proxy for online programs—helps add clarity to the often murky master’s market and is summarized below in Table 1.
Table 1. Master's and Bachelor’s Degree Completions Growth (Compound Annual Growth Rate)
| 2018 | 6-Year CAGR | YoY Change | |
|---|---|---|---|
| All Master’s Programs | 38,700 | 2.6% | 1.3% |
| Master’s Distance Programs | 8,200 | 9.7% | 6.6% |
| Master’s Programs Completions | 823,000 | 1.7% | 1% |
| All Bachelor’s Programs | 77,500 | 0.9% | 0.4% |
| Bachelor’s Distance Programs | 7,200 | 5.1% | 6.8% |
| Bachelor’s Programs Completions | 2,088,000 | 1.4% | .08% |
Source: NCES IPEDS. Figures rounded to nearest hundred.
Table 1 indicates that the number of distance master’s programs has grown significantly; more than 20% of master’s programs are now offered via distance format. For comparison, distance programs now represent 9% of all bachelor degree programs. The bachelor’s degree marketplace has grown at a lower rate in terms of the number of programs offered over the six-year period (1% growth), while online bachelor’s programs have grown significantly (5%), although not as much as at the master’s level (10%).
Figure 1 shows how the 25 largest master’s degree programs have performed and how competitive their markets are based on the number of institutions offering distance programs within the same fields of study. The top 25 largest master’s programs are profiled by their respective fields of study and numbers of degrees completed in 2018. As there is not yet a formal measure of the number of completions by distance programs alone (although this data point is high up on our Christmas wish list), we used the total number of completions per program, which includes both distance and non-distance programs.
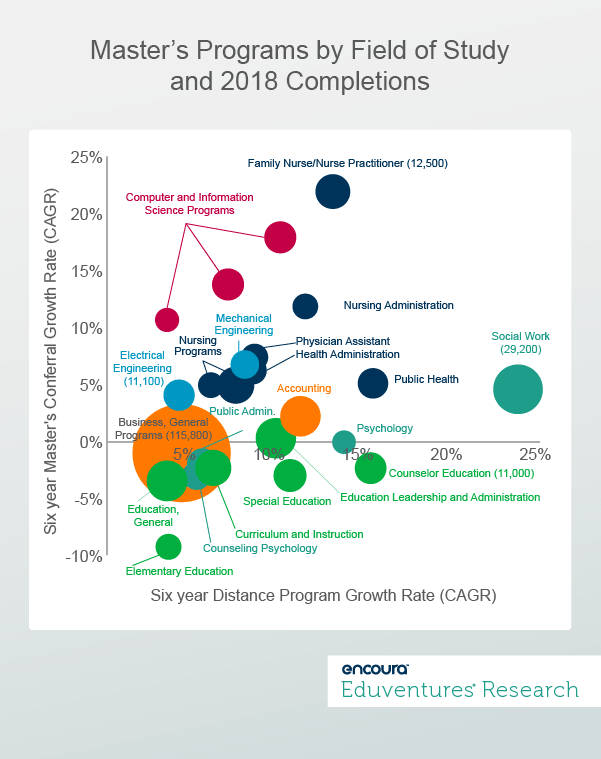
| Color Key | Program Names |
|---|---|
| Education | General Education, Education Leadership, Curriculum and Instruction, Special Education, Counselor Education, Elementary Education |
| Business | Accounting, Business General (2 programs) |
| Computer and Information Sciences | Computer and Information Sciences (3 Programs) |
| Psychology, Public Administration, Social Work | Social Work, Public Administration, Psychology, Psychology Counseling |
| Health Professions | Nursing/RN, Family/NP, MPH, PA, Occupational Therapy, Healthcare Admin |
| Engineering | Electrical Engineering, Mechanical Engineering |
What can we learn from Figure 1?
1. More schools are adding more online master’s programs in all of the most popular fields of study.
Not a single top 25 program has declined in terms of the number of programs offered. In fact, over the six-year period measured, 809 new distance programs were reported to NCES, an increase of 42%. This indicates that even for programs of shrinking completions—which likely translates to shrinking enrollments—the competition is increasing and online formats are becoming the norm that many master’s level students expect.
2. Programs focused on computer and information science have seen the highest completion growth rates.
Program completions in the top three computer and information science programs grew by 40 programs, or 34%. It is worth noting that IPEDS categorizes these programs quite broadly compared with many others, and so the comparison may not be satisfactorily apples-to-apples. With that said, however, they are the least saturated in terms of new programs. This trend reflects how institutions are making notable efforts to increase the way that students at all levels can learn technical computer skills; a recent example is Virginia’s recent billion-dollar pledge to grow computer science programs at 11 different institutions.
Technology companies also continue to emphasize new hiring practices based on skill rather than degree requirements, partnering with community colleges and online course providers to fill technology-related jobs. This heightens competition for some master’s programs to demonstrate value beyond skills training. It will also likely lead to increased competition on price—just as Georgia Tech and University of Pennsylvania have done with low cost, predominantly online master’s in computer science offerings.
3. The business master’s market is both a behemoth and a Rubik’s Cube.
The combination of curriculum, cost, corporate partnerships, competition, and convenience often dictate how successful the masters in business programs are. Business-specific programs, in analytics, accounting, and the many different flavors of the all-mighty MBA, will all continue to attract students looking to learn general business skills. While completions in general business master’s programs have declined by some 8,000, the total number of students is well north of the nearest program—social work—with nearly 90,000 more completions.
We do expect, however, that there will continue to be increased offerings from programs in specific business career fields (think masters in healthcare management). Those programs that successfully communicate the value of the business skills they teach along with discipline-specific elements of the curriculum, will steadily draw career minded students looking to skill-up in a specific industry.
4. Education programs have seen sustained declines in both completions and enrollments while new programs continue to pop up.
About 260 new distance programs were reported in 2018 while there were nearly 13,000 fewer completions. The combination of demography and competition from institutions and low(er) cost, for-profit providers of professional development make such programs difficult to sustain. It would be risky for an institution to launch new education programs without an established foothold and reputation for providing education programs already.
5. Engineering program growth (through the lens of IPEDS) is deceptive.
IPEDS indicates that engineering program growth has matched completion growth, indicating relative health and room for further expansion. But this is only part of the picture. Complimentary data from the Council of Graduate Schools (CGS) shows an 8.3% decrease in first-time enrollment for master’s-level engineering programs from 2017 to 2018; data that may not have yet caught up with completions.
While declining international student enrollment plays an outsized factor in engineering graduate programs that have historically attracted more international students, lower international student enrollment will continue to more broadly impact all programs at varying levels. The CGS reports a 1.3% decline in international student enrollment between 2017 and 2018 across all graduate programs.
The Bottom Line
While we continually read of declines and constraints in the higher education sector, online programs—particularly at the master’s level—have been, and will continue to be, in growth mode. Some of the growth discussed here is simply the continued normalization of online education and comes of little surprise.
The other story, however, is where growth opportunities lie for institutions considering development of new master’s programs and what the reasonable expectations from those programs should be. Entering saturated fields of study by bringing a non-distance program into an online format or building a new program must take into account a range of factors. While the national trends, positive or negative, are not prophetic, or even the most relevant consideration for every local market, they are undeniably important considerations.
Thursday, December 5, 2019 at 2PM ET/1PM CT
In this webinar, Eduventures Chief Research Officer Richard Garrett explores rarely analyzed program and enrollment trend data, drawing on two decades of program feasibility work for hundreds of colleges and universities nationwide. This throws new light on three fundamental questions:
- Over the past decade, is enrollment by field of study best characterized by change or continuity?
- To what extent have the most successful schools – in terms of enrollment – relied on launching new programs?
- What is the optimal program portfolio size by enrollment scale?
The goal of this webinar is to better inform higher education leaders about the power and pitfalls of new programs. Leaders spanning traditional age and adult, campus and online, and undergraduate and graduate programs will benefit from this session.
Thank you for subscribing!
Thank you for subscribing!